Analytics
Glossary
GMV = Sales Price of product (package) X Number of package that sold existing customer = user that already been book from your restaurant before
Features
Performance Review Page
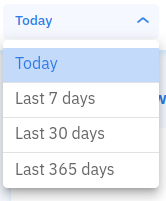
Performance Review Filter
You can pick to show the the Performance Review for today, last 7 days, last 30 days, or last 365 days.
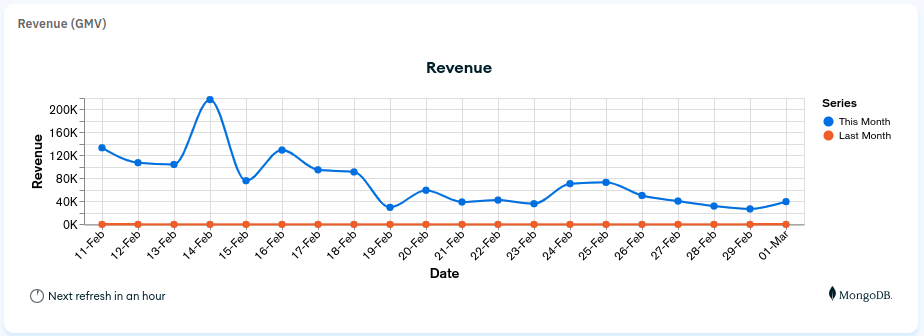
Revenue (GMV) Section
it will shows the GMV growth within the time frame that you picked.
Example:
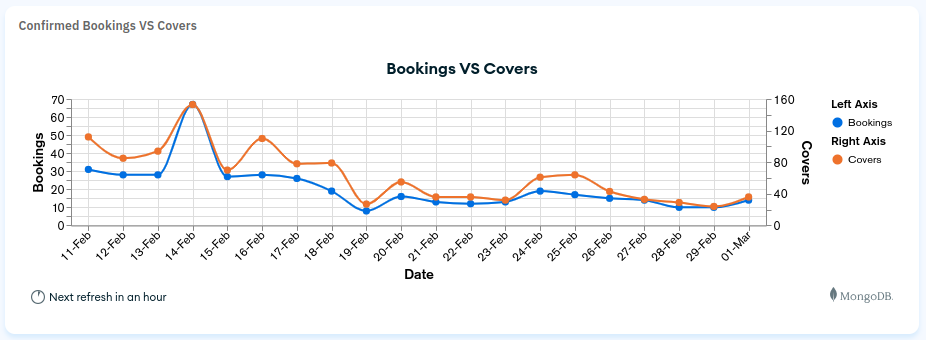
Confirmed Bookings VS Covers Section
it will shows the booking and covers growth within the time frame that you picked.
Example:
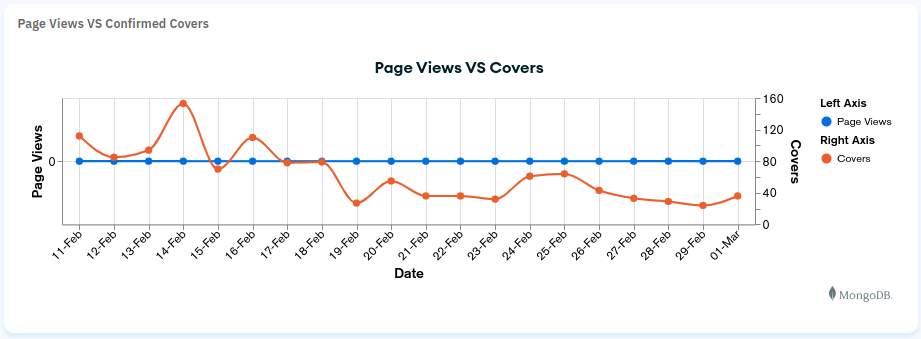
Page Views VS Confirmed Covers Section
it will shows how many user see your restaurant page and the covers growth within the time frame that you picked.
Example:
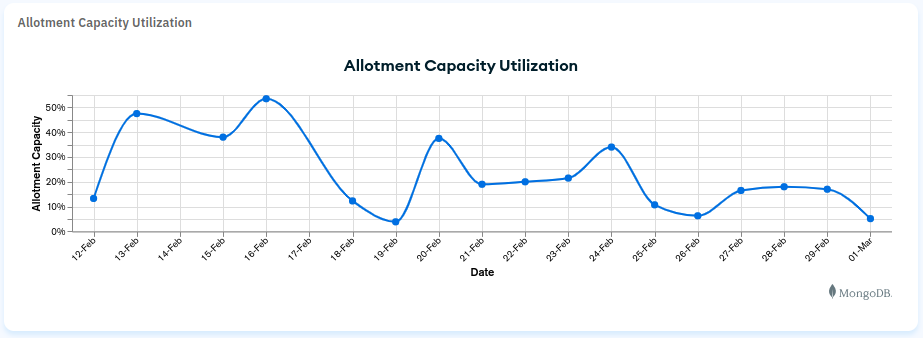
Allotment Capacity Utilization Section
it will shows how many Allotment Capacity Utilization.
Example:
Rating, Review & Photos Section
It shows the details of the review of your restaurants
Package comparison Section
It shows the details comparison between the package that you have.
Party Size Comparison Section
It shows the details comparison between person who book 1 pack, 2 pack, 3 pack, 4 pack, 5 pack and 6+ pack.
Existing vs New customers Section
It will shows you the percentage of booking made by existing customer vs new customer.
Average Spending Per Cover Section
It will shows you the percentage and the total average spending per cover.
Cancelled Bookings Section
It will shows you the percentage and the total of cancelled booking.
Ranking Page
Ranking Section
- It will shows you your Today's GMV
- It will shows your restaurant ranking in your location, it will shows you if the rank was going up or going down
- It will shows your restaurant ranking on your cuisine, it will shows you if the rank was going up or going down
- It will shows your restaurant ranking on your pacakage type, it will shows you if the rank was going up or going down
How to add charts from mongo db
First, we need to open our mongo db dashboard, select project hungryhub-production and then choose tab charts
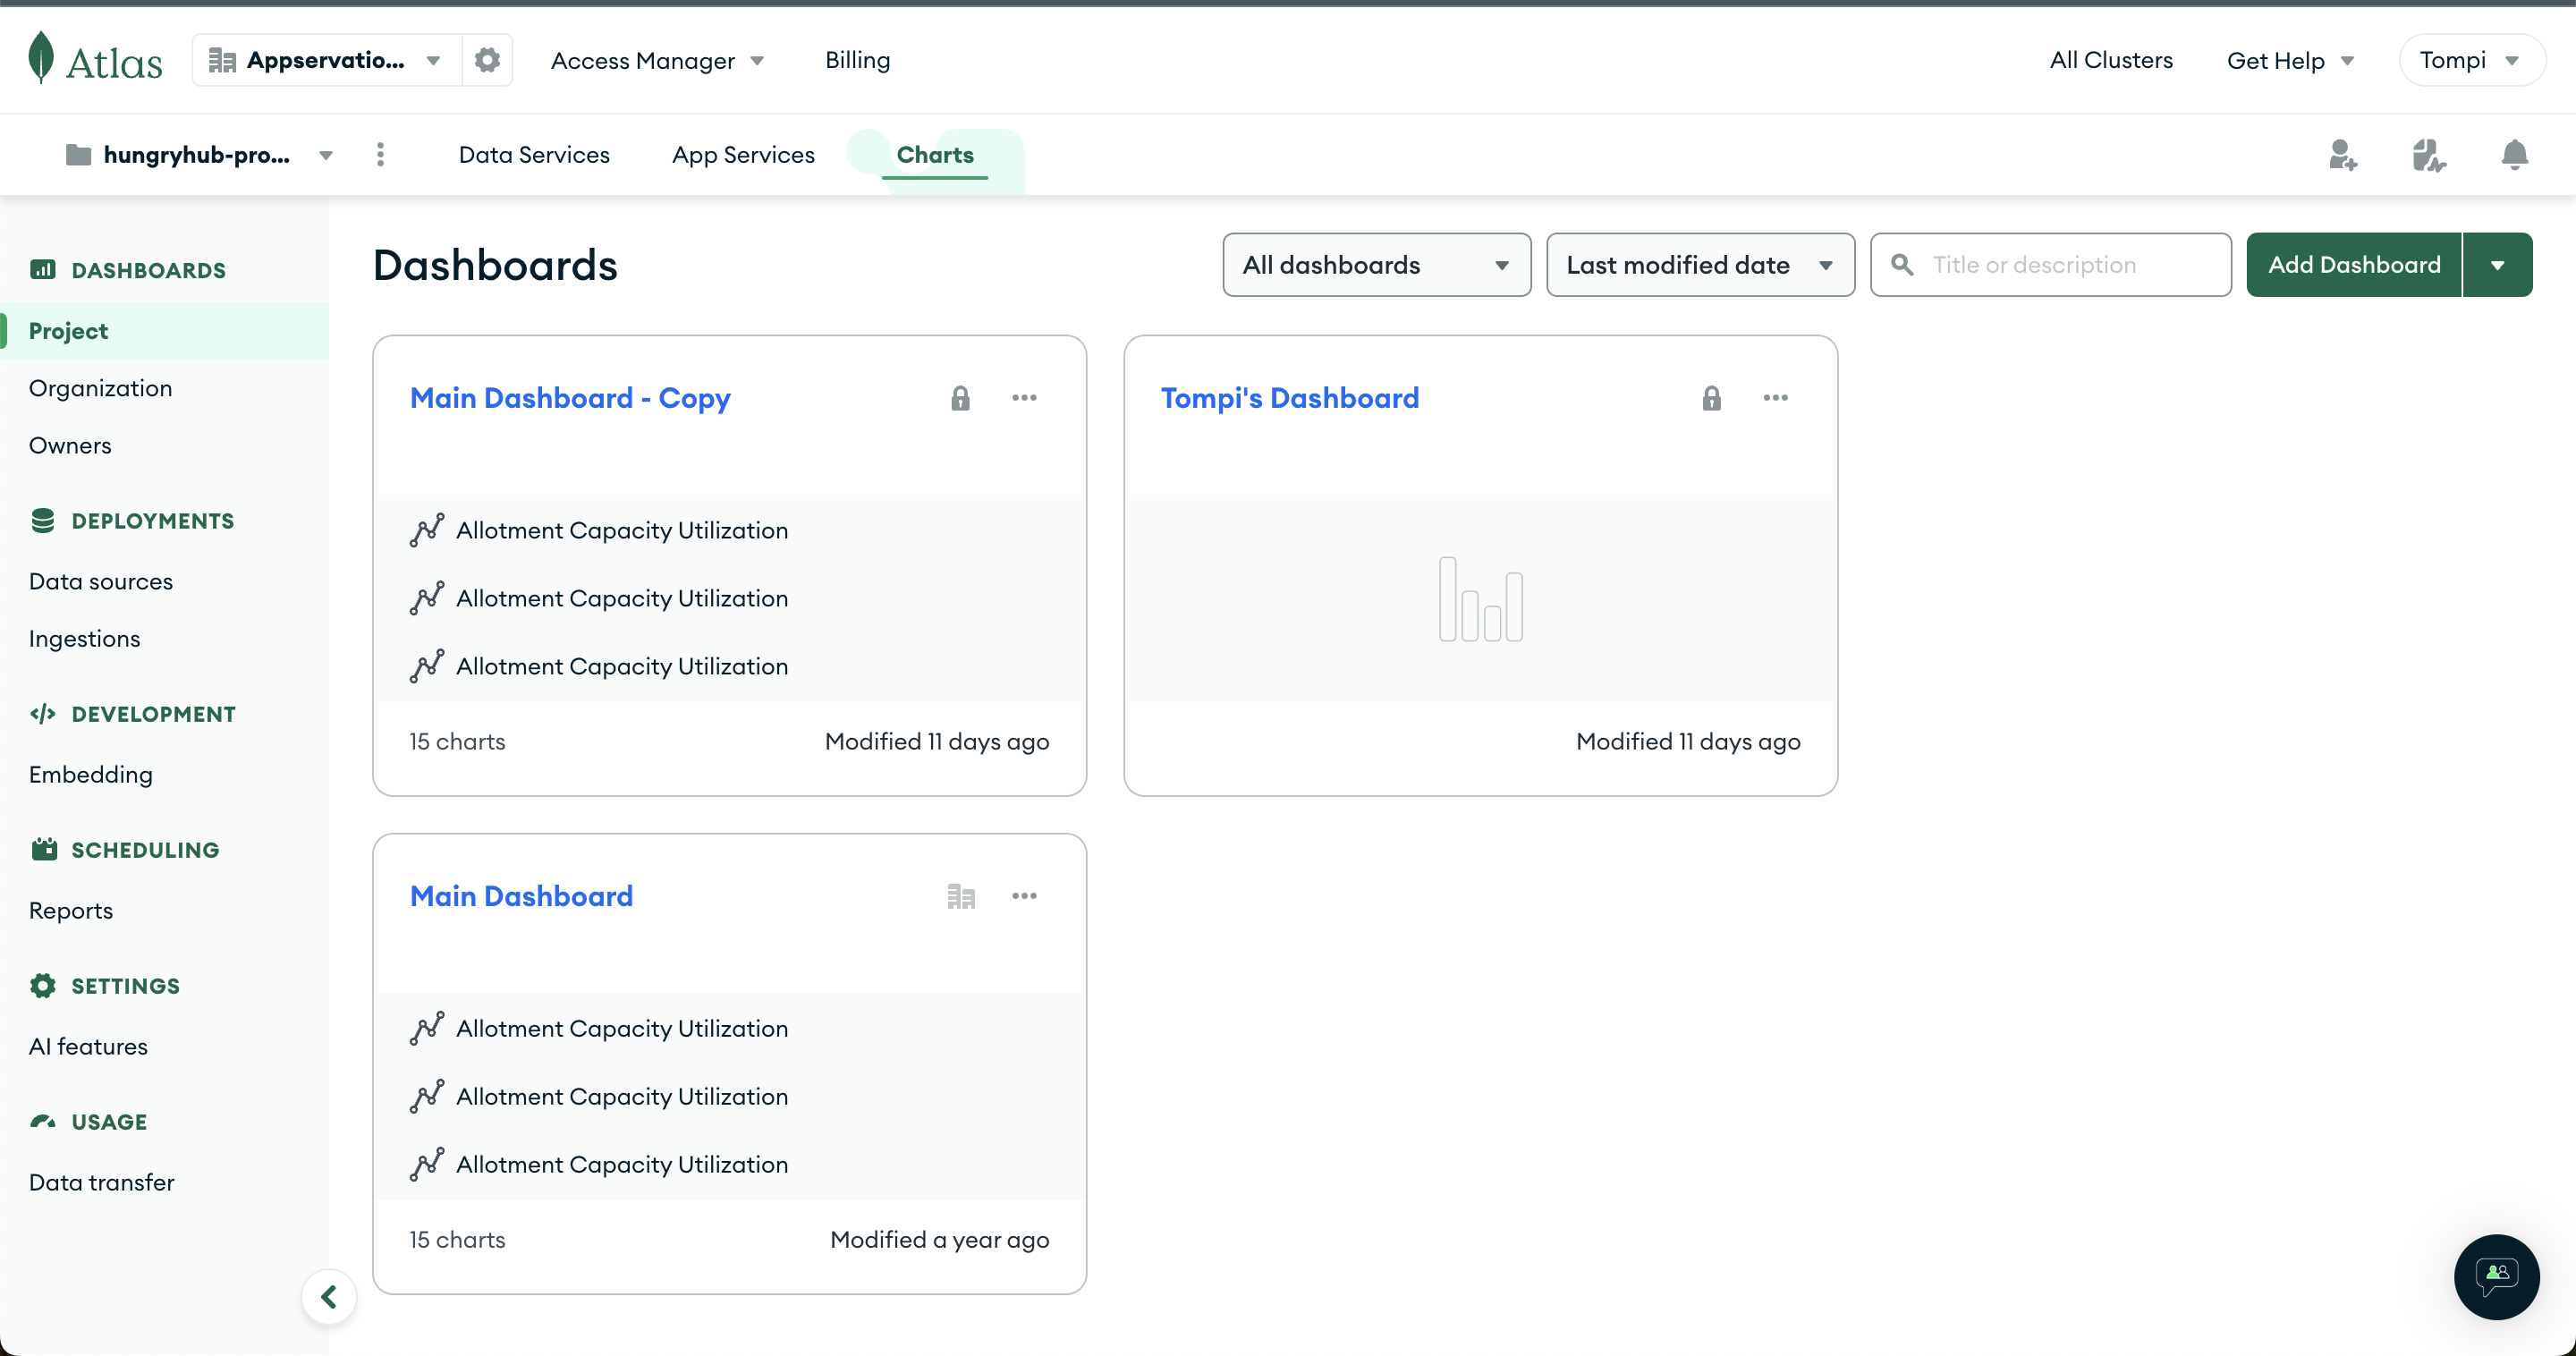
Our existing is read only, I already duplicate Main Dashboard to explore. We can duplicate revenue from existing main dashboard.
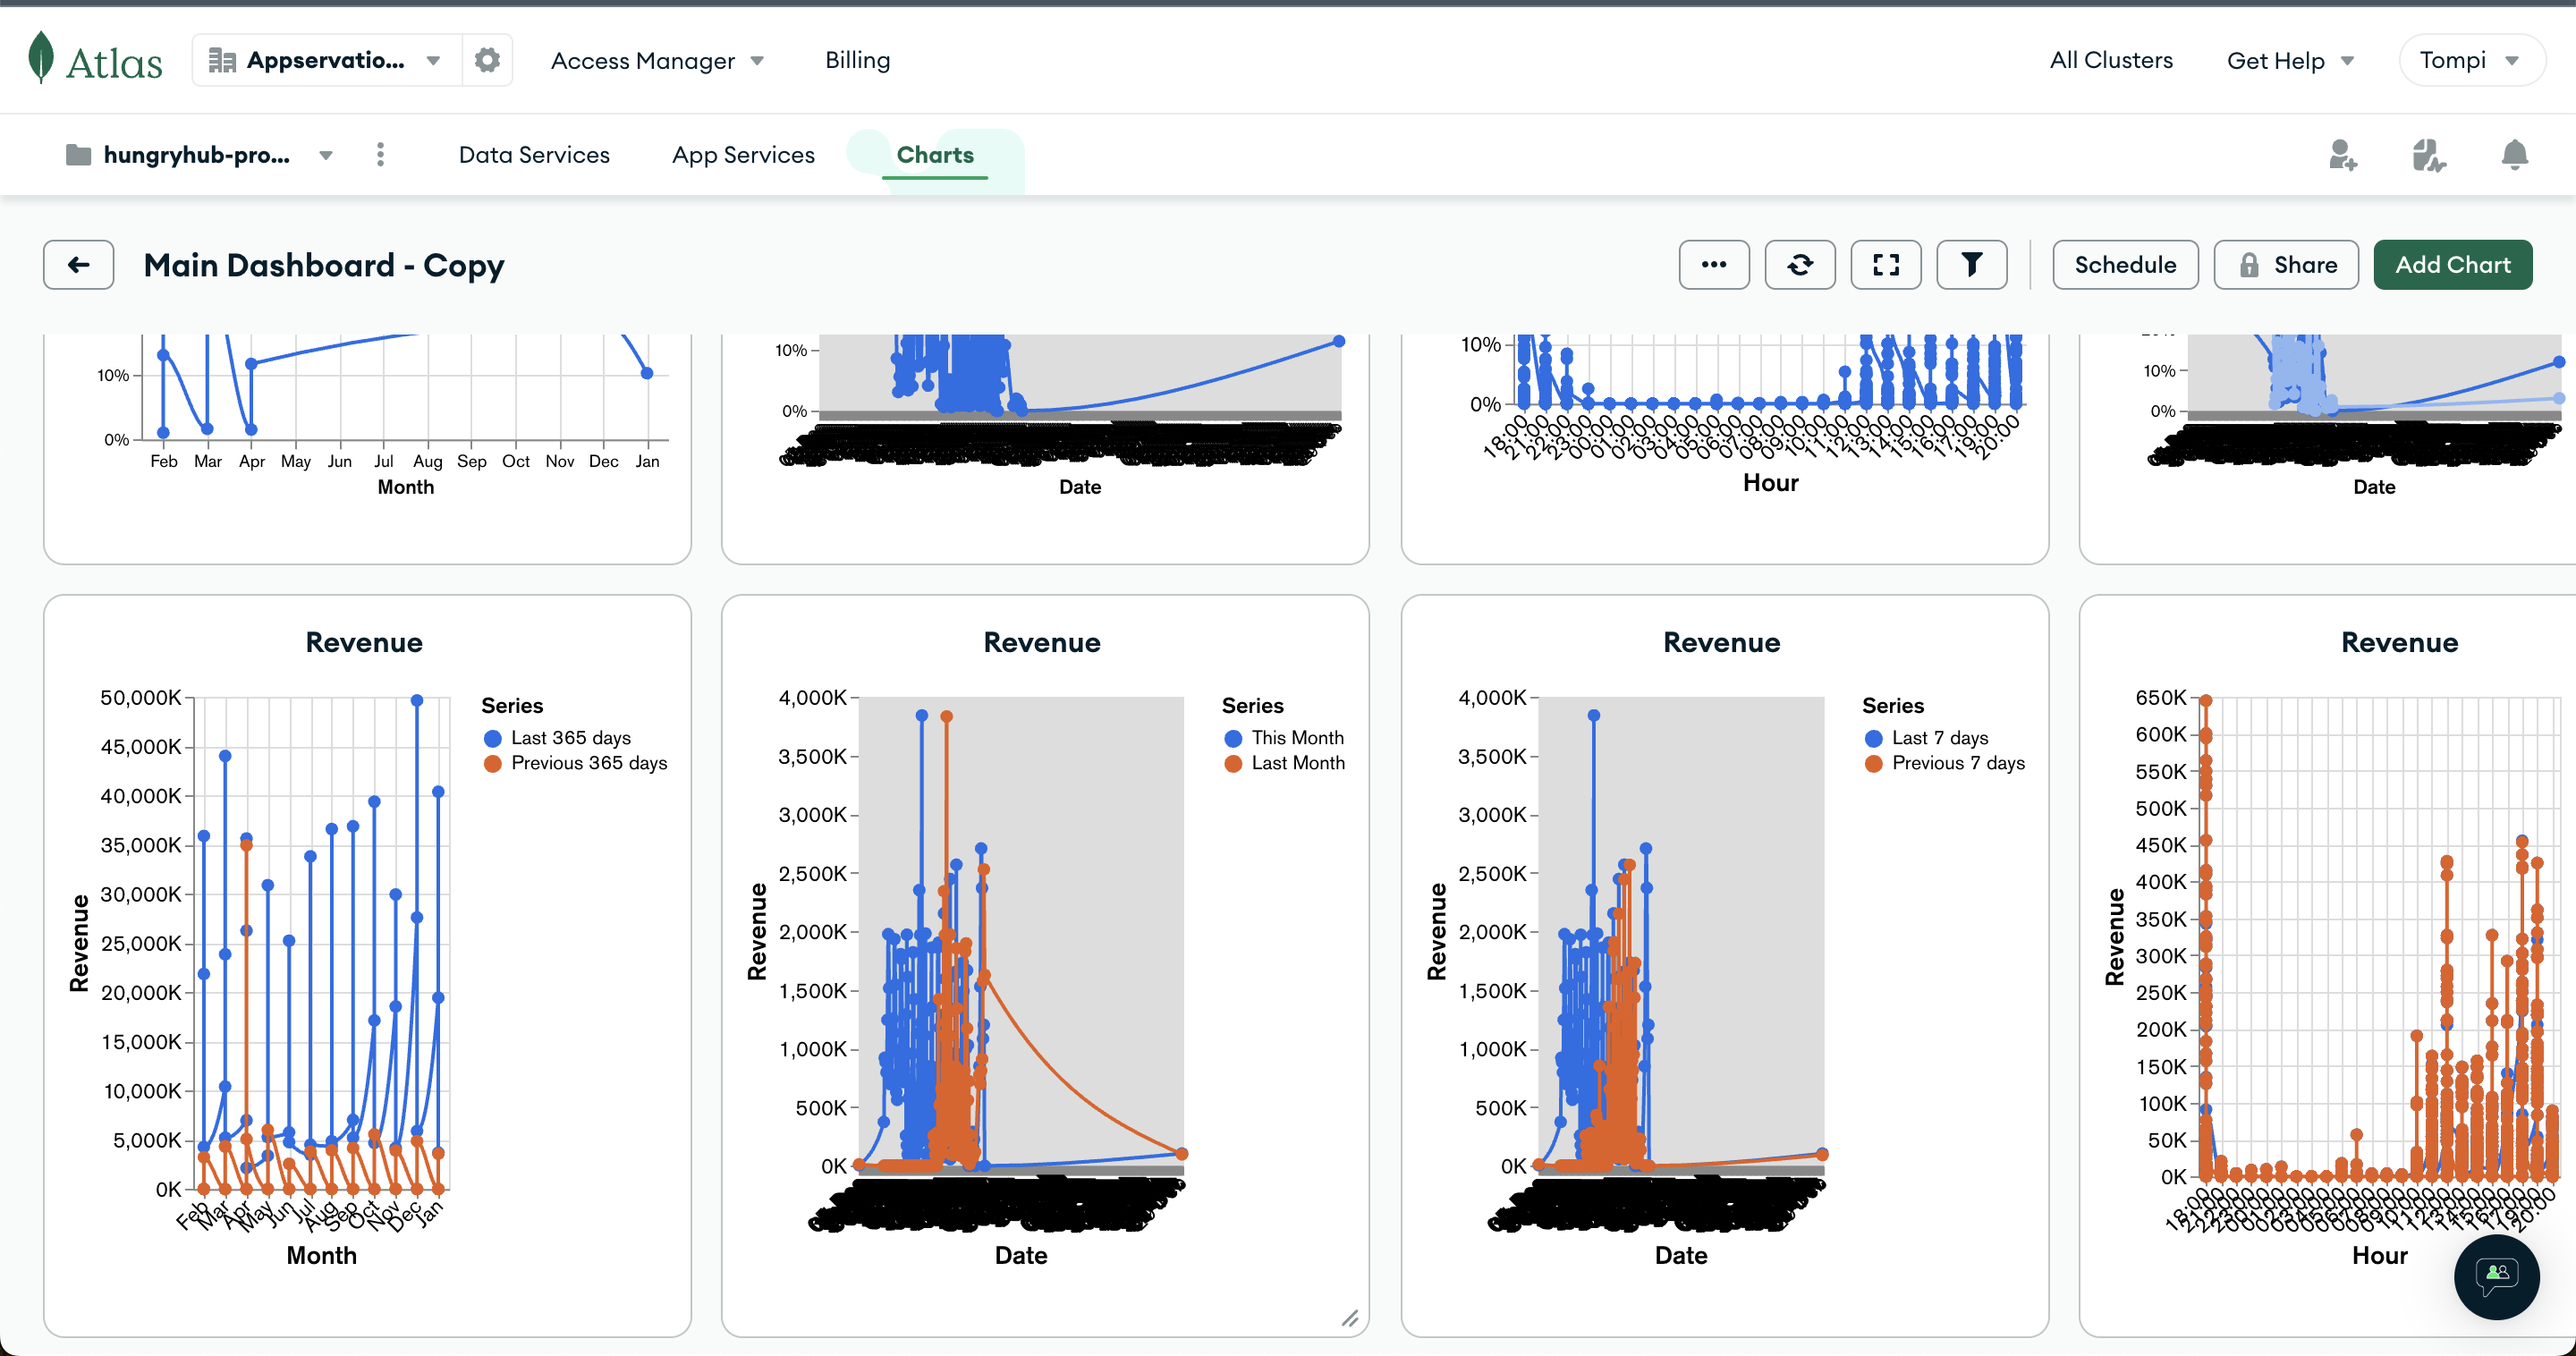
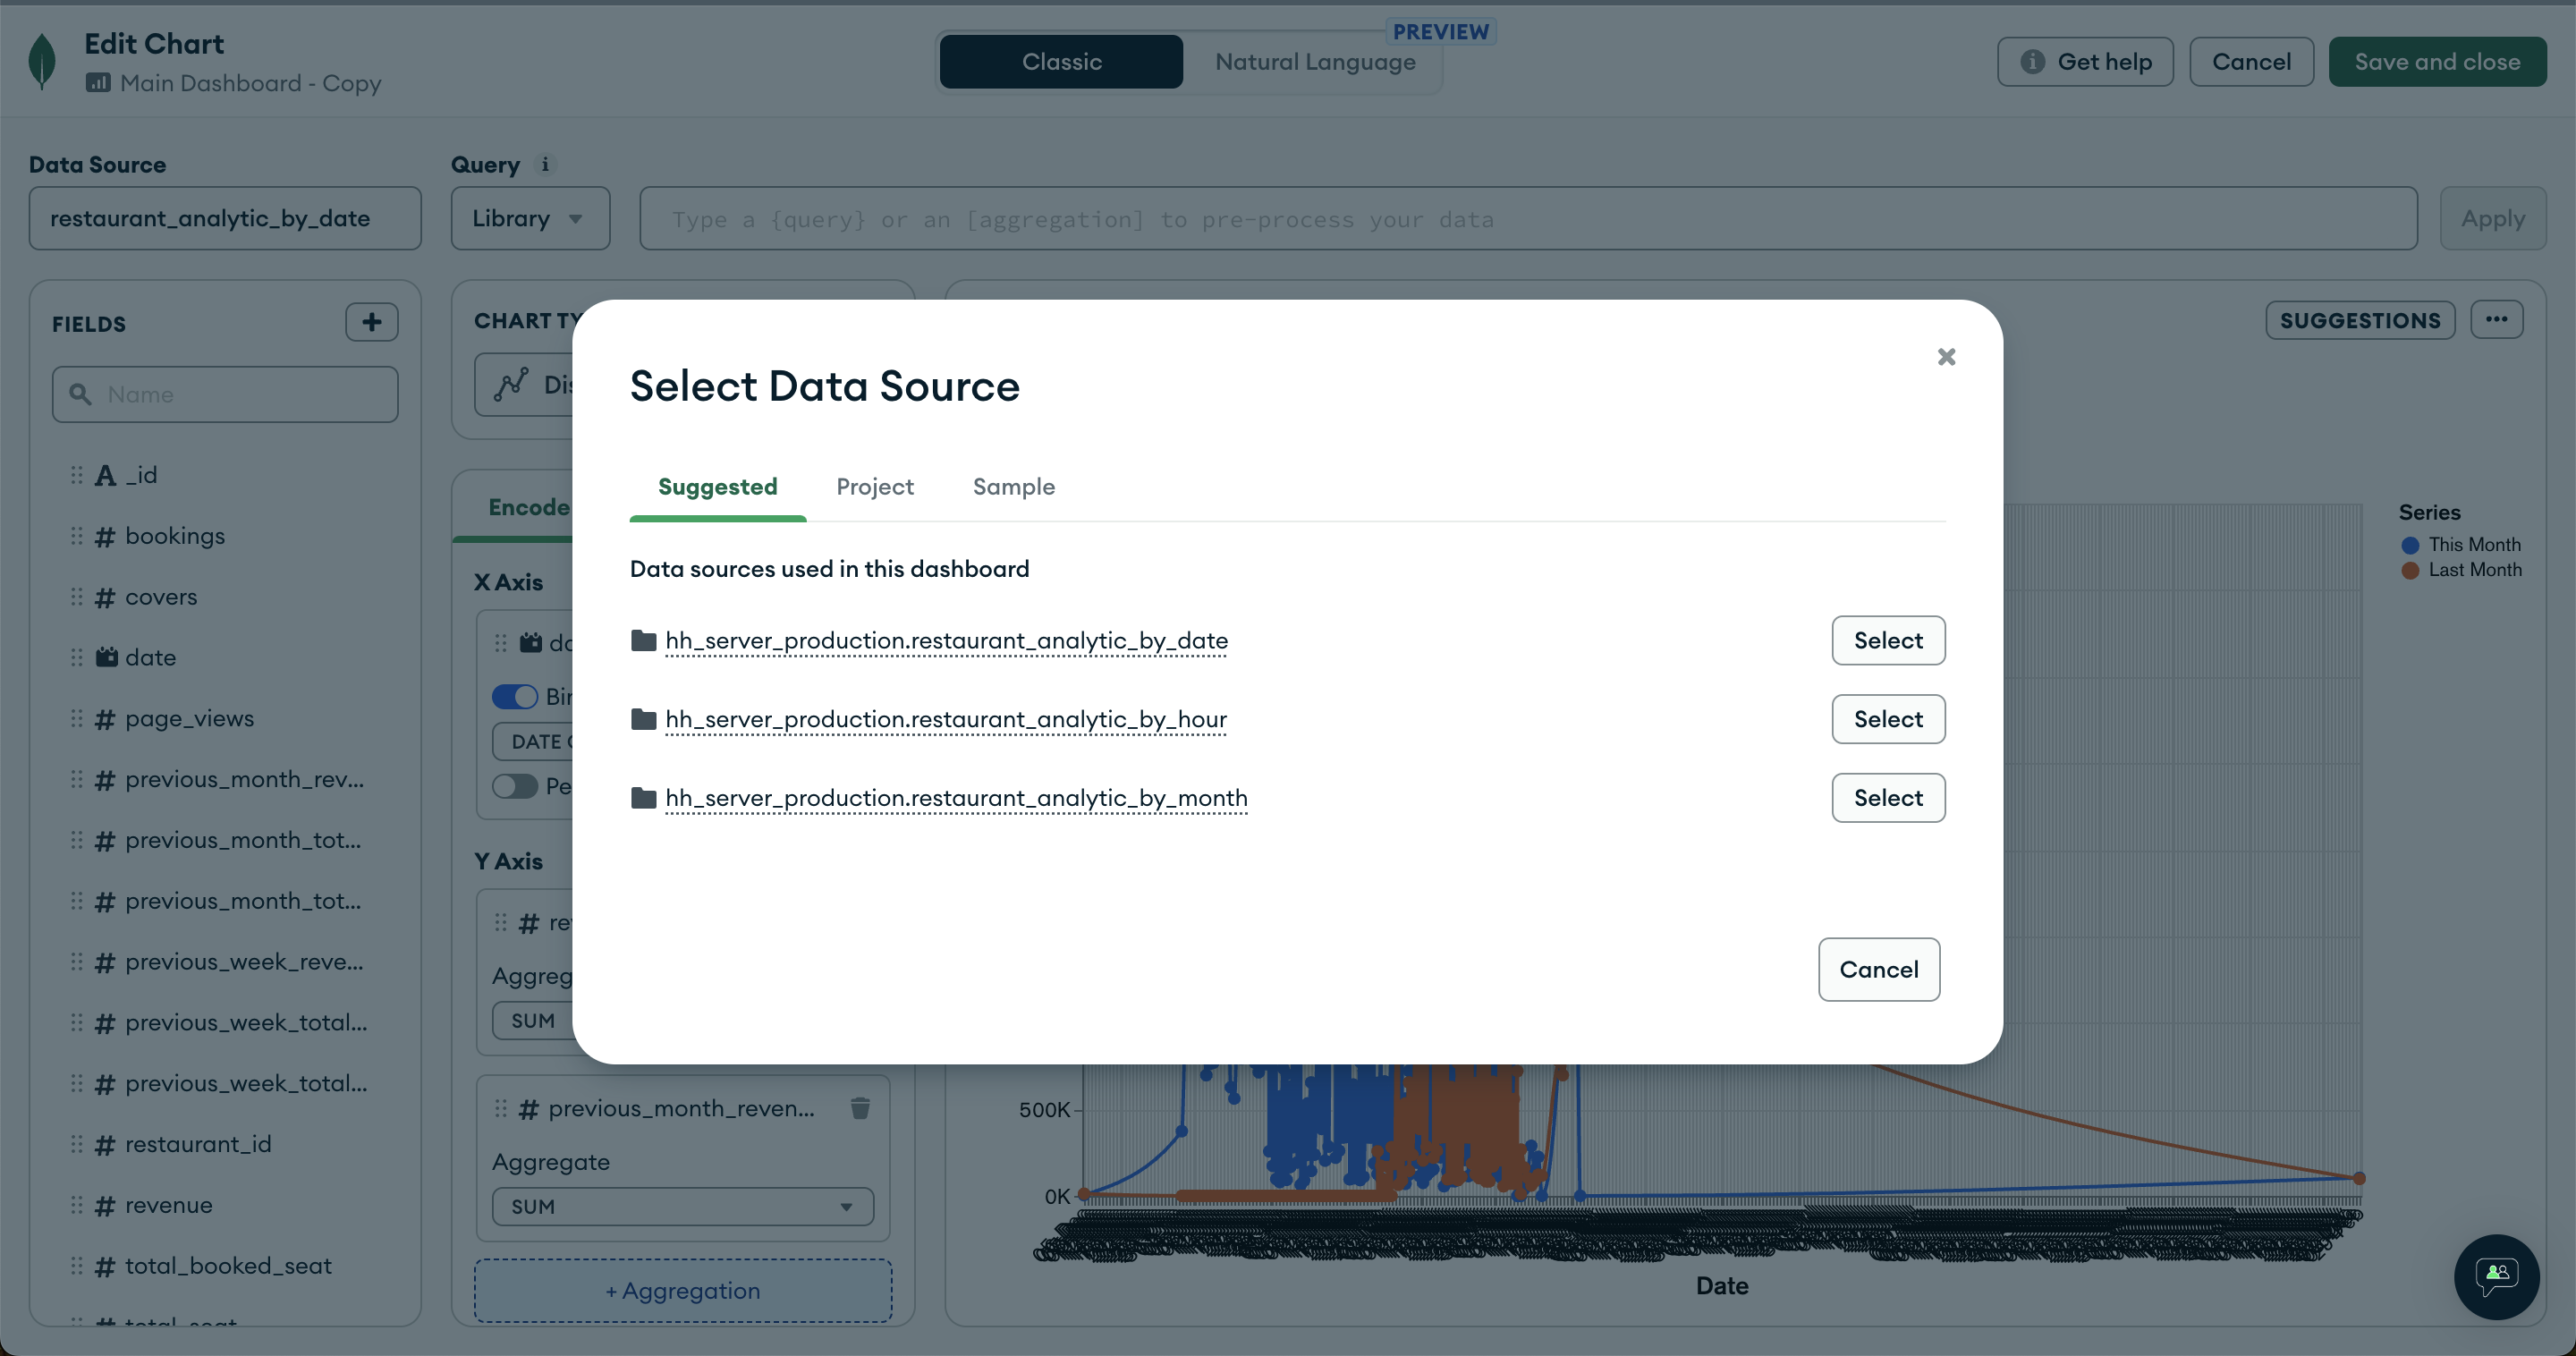
If we click edit on some chart we can see how to create charts, we need to select data source, and select field to setup on the charts.
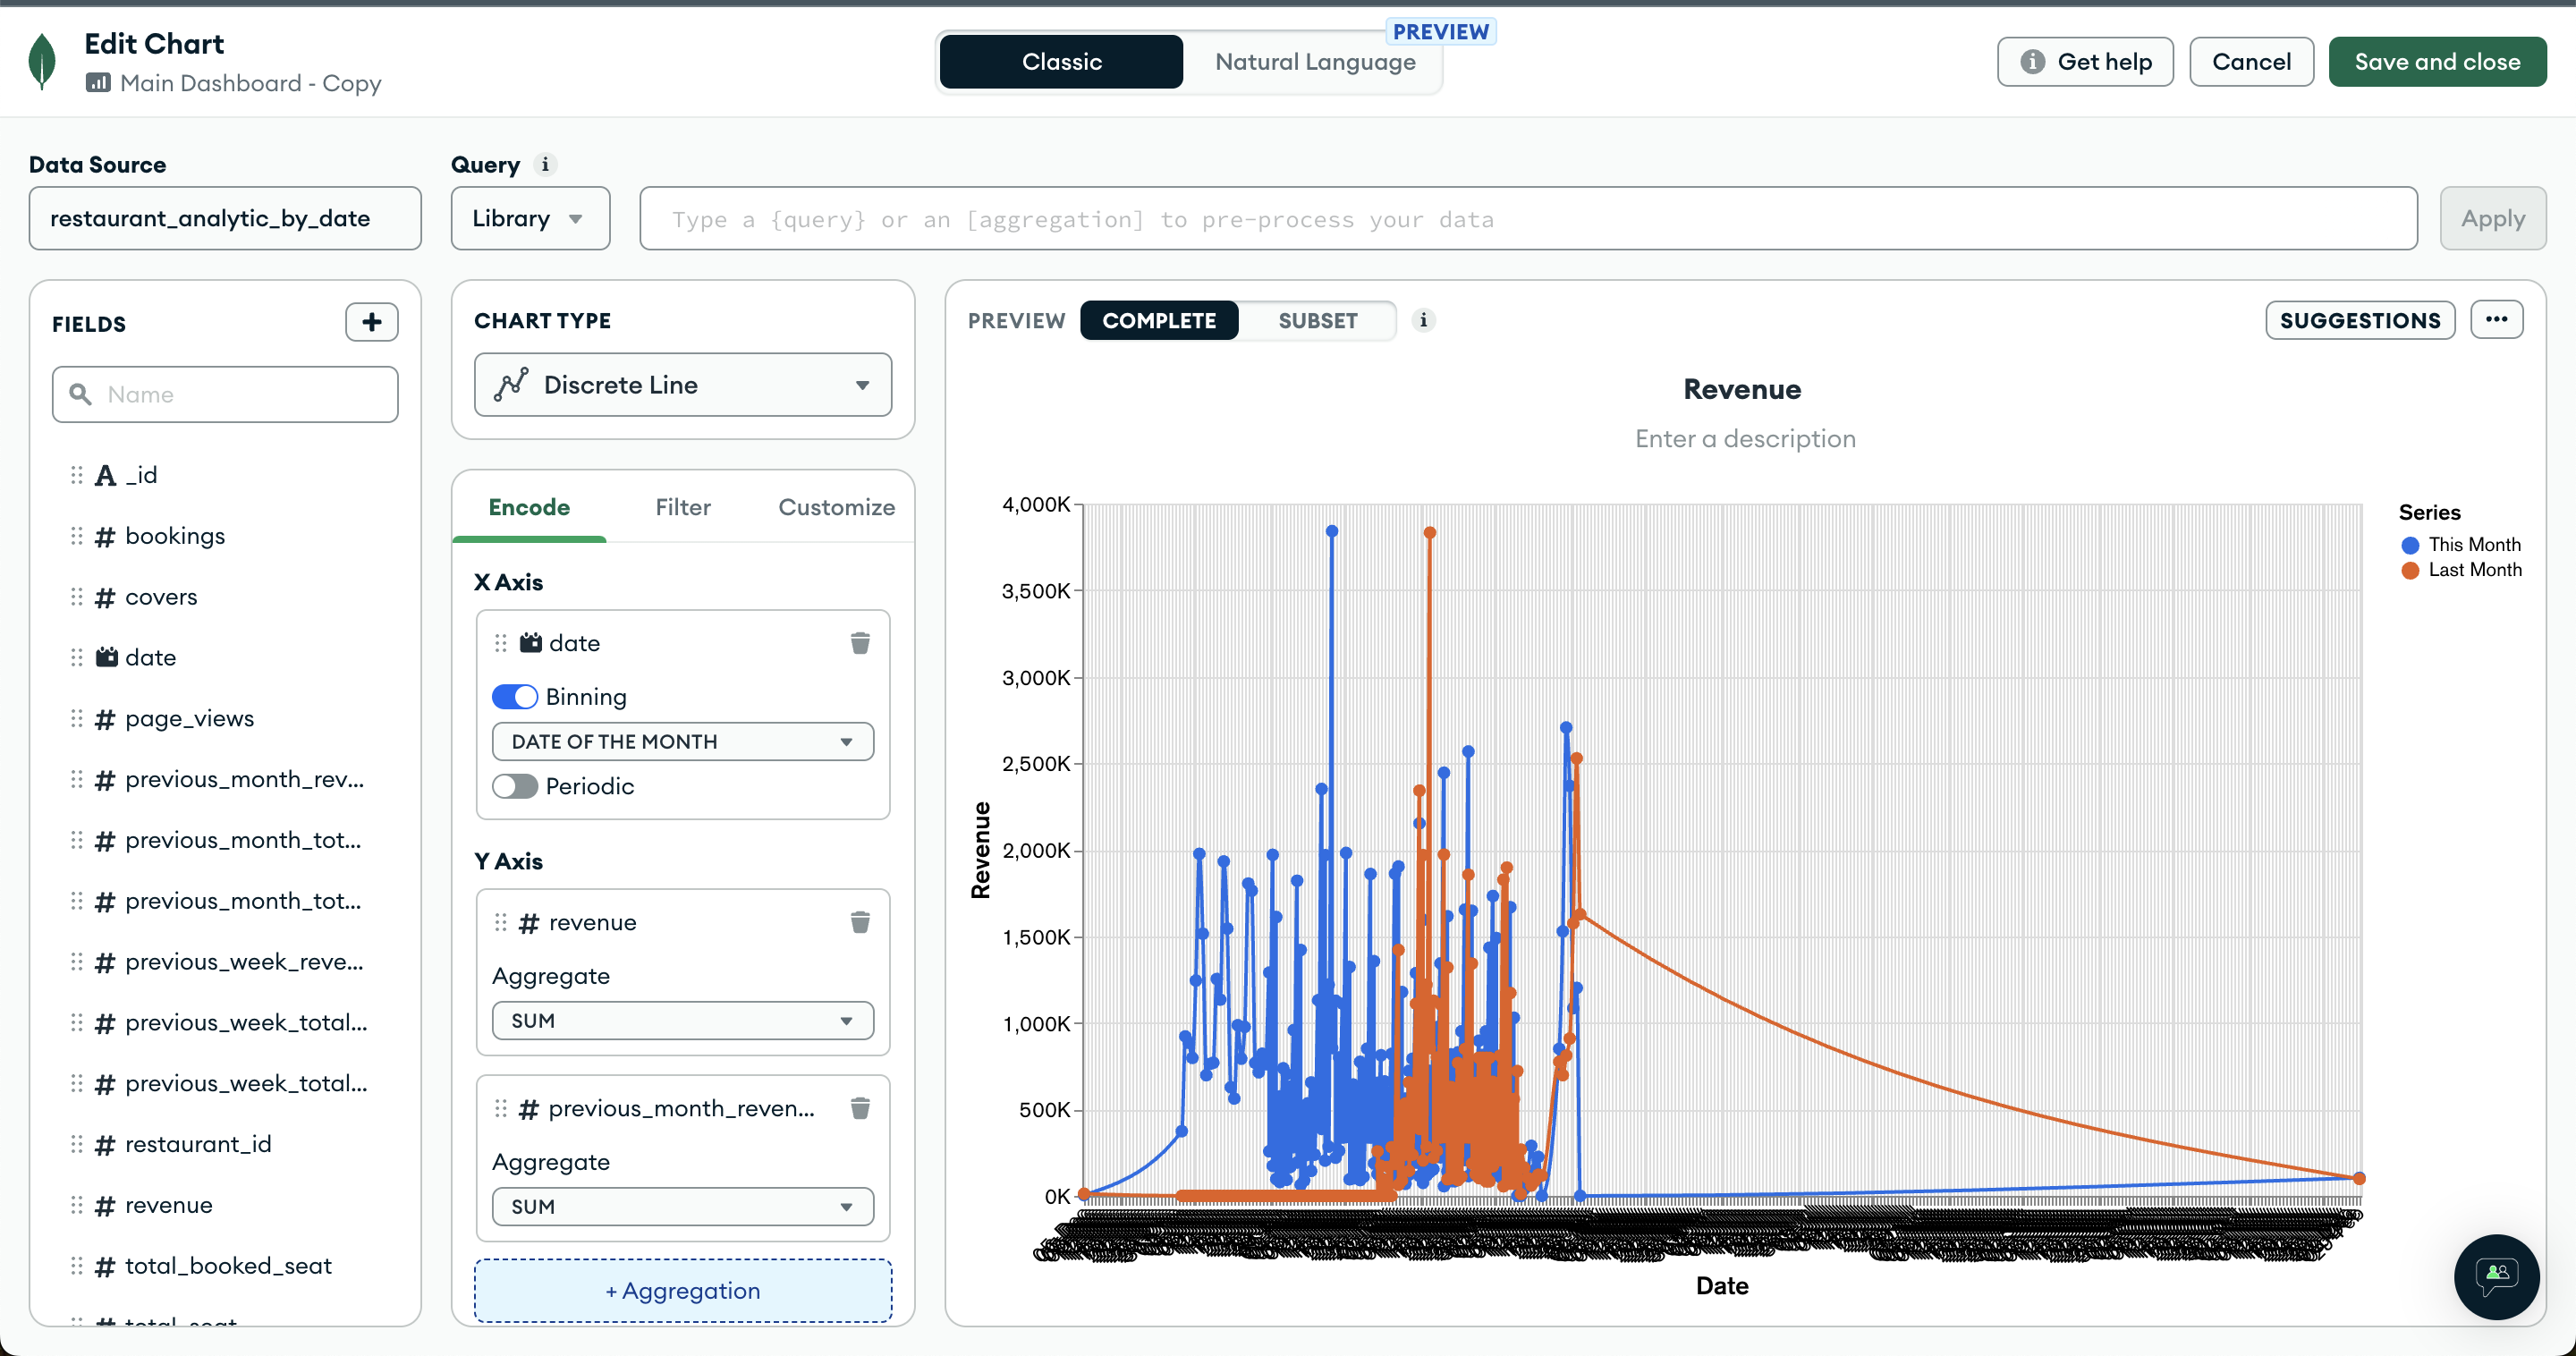
Each data source can have some field, and for edit field we can check on mongo_db_sync_restaurant_data_worker.rb
 We will have 3 new date ranges:
This Month
Last Month
Last 3 months
We will have 3 new date ranges:
This Month
Last Month
Last 3 months
For this month I think we can use our existing charts on dashboard, and add the rest if not available yet.
The field that we need to add for new charts:
- last two month revenue
- last 3 month revenue
- last two month booking vs cover
- last 3 month booking vs cover
- last two month views vs covers
- last 3 month views vs covers
- last two month allotment capacity
- last 3 month allotment capacity
Please explore more, CMIIW.