How to see our code performance in local/development environment
We use rack-mini-profiler gem to track our controller's code. It has the following features:
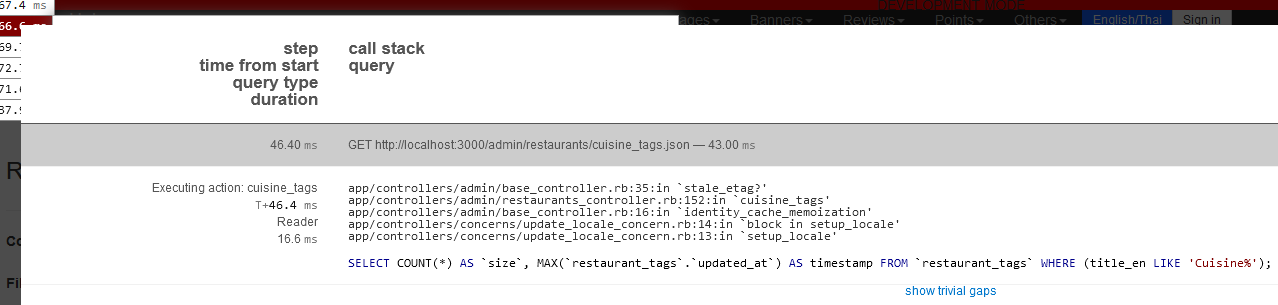
- SQL Query Analysis: View detailed information about the SQL queries being executed, including execution time and query structure.
- Performance Metrics: Monitor key performance metrics to identify slow endpoints and optimize them accordingly.
How to use it
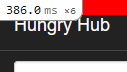
If the controller has an HTML view, we can see it at the top left page:
HTML VIEW
http://localhost:3000/admin/restaurants
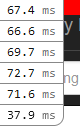
 If we click it, it shows the details like this:
 it means there are 6 requests happened during we open the page
We can click each one to see the more details.
We can click any text with
it means there are 6 requests happened during we open the page
We can click each one to see the more details.
We can click any text with blue color, such as:
REST API
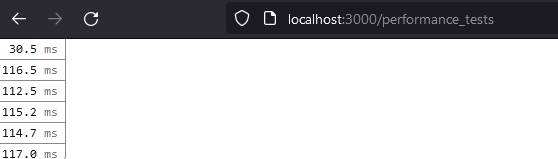
If the controller doesn't have an HTML view, we need to open http://localhost:3000/performance_tests
Then, call the API using Postman or the Insomnia app. You can refresh the Performance Test page and you will see this UI
 If it doesn't show the latest API call report, you can do a hard refresh (Shift + Ctrl + R) or disable the cache using the Browser console
The
If it doesn't show the latest API call report, you can do a hard refresh (Shift + Ctrl + R) or disable the cache using the Browser console
The /performance_tests page provides detailed information about SQL queries and overall performance metrics for our APIs. This will help us identify and address performance bottlenecks more effectively.