How to see our code performance in Production Environment
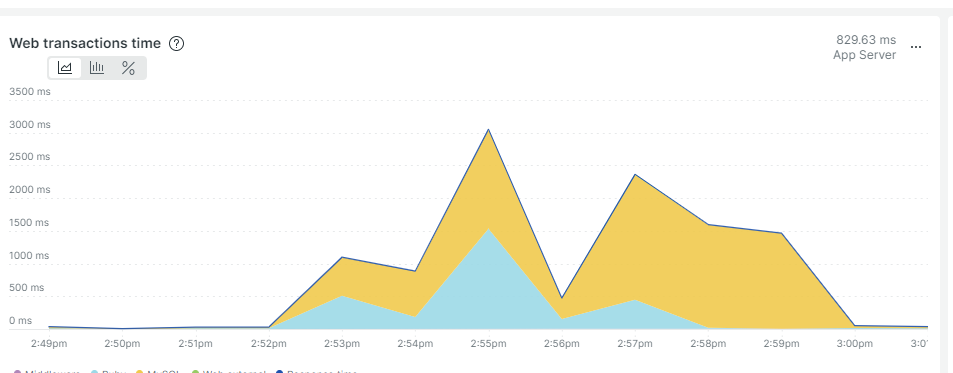
when new relic shows a slow report like this
 you can take a look at the Transactions section
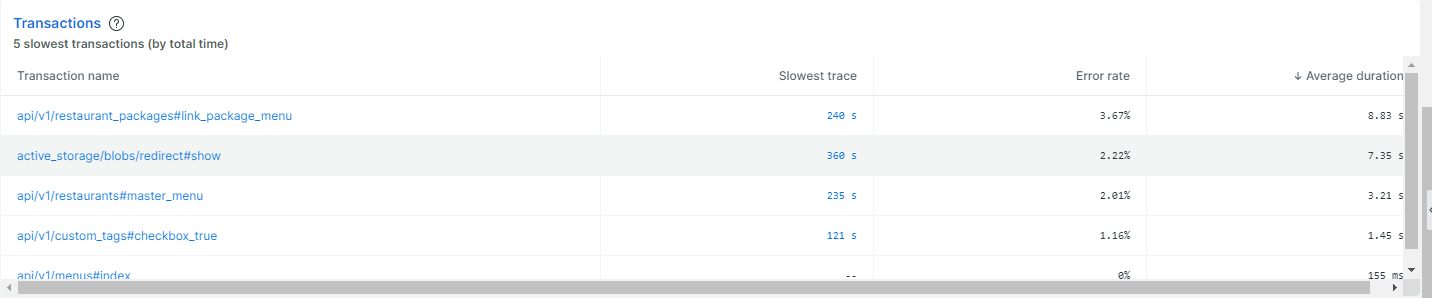 then click one of them
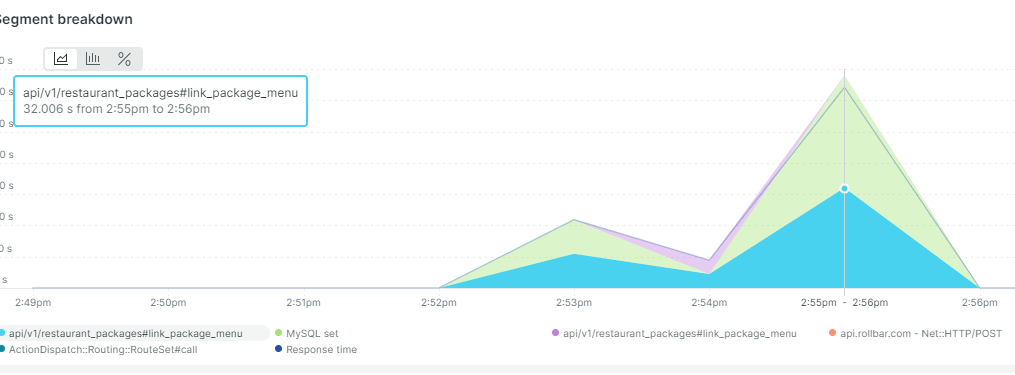
if you hover your mouse to this chart, it means Ruby code has spent 32 seconds to load
then click one of them
if you hover your mouse to this chart, it means Ruby code has spent 32 seconds to load
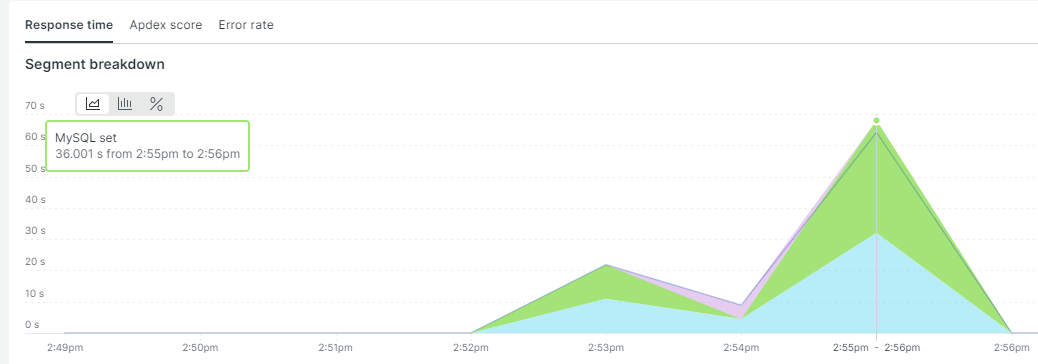
 and MySQL 33 seconds
 and then scroll down and click one of the transaction link
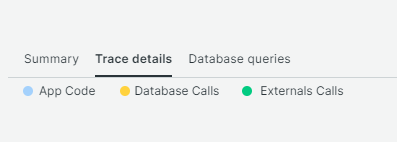
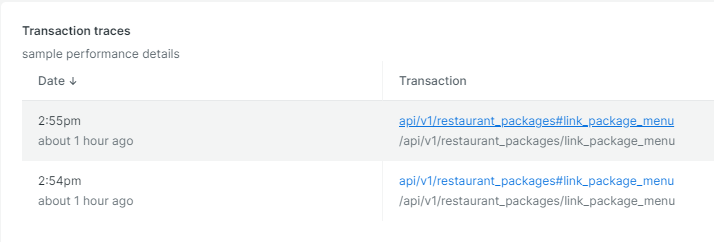 you will find out what is the cause of the slow response on trace details and database queries
 one controller normally has 1-3 DB queries, if more than that, you need to improve the code. You can utilize identity_cache gem or Rails cache to improve the performance
if trace details is not clear, you can add a custom tracing to your Ruby method, see more at
one controller normally has 1-3 DB queries, if more than that, you need to improve the code. You can utilize identity_cache gem or Rails cache to improve the performance
if trace details is not clear, you can add a custom tracing to your Ruby method, see more at
[
Ruby custom instrumentation
For information about customizing New Relic's Ruby agent API to collect additional metrics, start here.
https://docs.newrelic.com/docs/apm/agents/ruby-agent/api-guides/ruby-custom-instrumentation/
](https://docs.newrelic.com/docs/apm/agents/ruby-agent/api-guides/ruby-custom-instrumentation/)