How to Run Hungryhub Automation Testing
R0unning automation tests efficiently is crucial for maintaining the quality and performance of the Hungryhub application. This section provides detailed instructions on how to execute these tests using our established tools and environments.
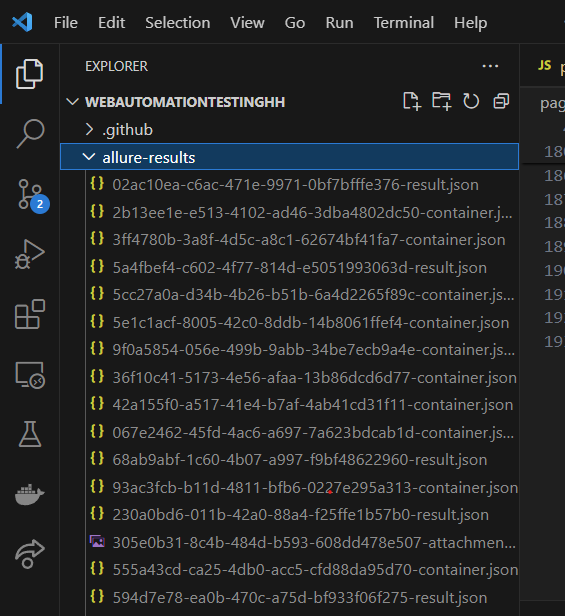
1. Repository Location
The automation testing scripts are inside the frontend (FE) repository located at:
- Repository URL: HungryHub FE Repository
Ensure you have access to the repository before proceeding.
2. Running Tests Locally
Before running the tests, make sure you have the following set up on your machine:
- Open Command Line: Navigate to your project directory in the command line.
- Execute the Test Suite: Run the following command to start the execution of the test suite:
npx playwright testThis command will execute all tests written for the Hungryhub application using Playwright.
3. Run Specific Tests
If you need to run a specific test file or a group of tests, use the Playwright CLI to specify the test path or tags. For example:
npx playwright test loginscenario.page
Running with tag npx playwright test --grep @fast
Other Argument on CLI
| --headed | Used to run the browser in visible mode, |
|---|---|
| --worker = 3 | Used in the context of running tests in parallel mode |
| --project=chromium | Used to run tests on the Chromium browser specifically, if you have test configurations for multiple browsers. |
Viewing Test Results
Effective test reporting is crucial for analyzing the outcomes of automation tests and making informed decisions. We utilize Allure Framework to generate detailed and visually appealing test reports. Below are the instructions on how to generate and view these reports after running your tests.
Generating Allure Reports Locally
After executing the tests using Playwright, you can generate an Allure report locally with the following steps:
- Generate Report:
- Ensure that Allure is installed on your machine. If not, you can install it using npm
npm install -g allure-commandline
- After test execution, generate the Allure report by running or allure result will automatically generated
2. Open Report: Run this command to generate and present the report:
allure serve
Trigger Automation via GitHub Action
Automation testing in HungryHub is triggered via GitHub Actions based on specific events like Pull Requests (PR), a scheduled time, or a custom workflow dispatch.
1. Deploy Preview (Pull Request)
When a Pull Request (PR) is created, the automation testing for scenario P1 is triggered using the deploy preview URL. This preview URL is based on the PR deployment (e.g., deploy-preview-793--hh-pegasus.netlify.app).
Workflow Trigger:
- Trigger: PR Creation (Deploy Preview)
- Test Scenario: P1 Scenario
- Test URL: Use the dynamically generated deploy preview URL (e.g.,
deploy-preview-793--hh-pegasus.netlify.app). - Manual Testing: Done by dedicated QA manually.
- Automation Results: Handled by QA Automation. QA will post a summary of the automation results and investigate any issues.
- Post-Automation Process: If the test passes, the PR can be merged into the
masterbranch
Pipeline:
[
github.com
https://github.com/hungryhub-team/hh-pegasus/actions/workflows/playwright.yml
](https://github.com/hungryhub-team/hh-pegasus/actions/workflows/playwright.yml)
Link Allure (Report Automation)
[
github.com
https://github.com/hungryhub-team/hh-pegasus/actions/workflows/pages/pages-build-deployment
](https://github.com/hungryhub-team/hh-pegasus/actions/workflows/pages/pages-build-deployment)
example link:
2. Scheduled Automation
Automation is scheduled to run at 9 AM every day, running the P1 scenario on the staging environment URL https://hh-pegasus-staging.netlify.app/?locale=en.
Workflow Trigger:
- Trigger: Scheduler (Daily at 9 AM)
- Test Scenario: P1 Scenario
- Test URL:
https://hh-pegasus-staging.netlify.app/?locale=en - Automation Results: QA will investigate and review the test results.
Access the Allure Report via URL
With every PR (pull request) triggered, the report will be published to the URL like :
https://hungryhub-team.github.io/hh-pegasus/<PR number>/index.html.
for example, the report for PR number 36 would be accessible here
https://hungryhub-team.github.io/hh-pegasus/36/index.html
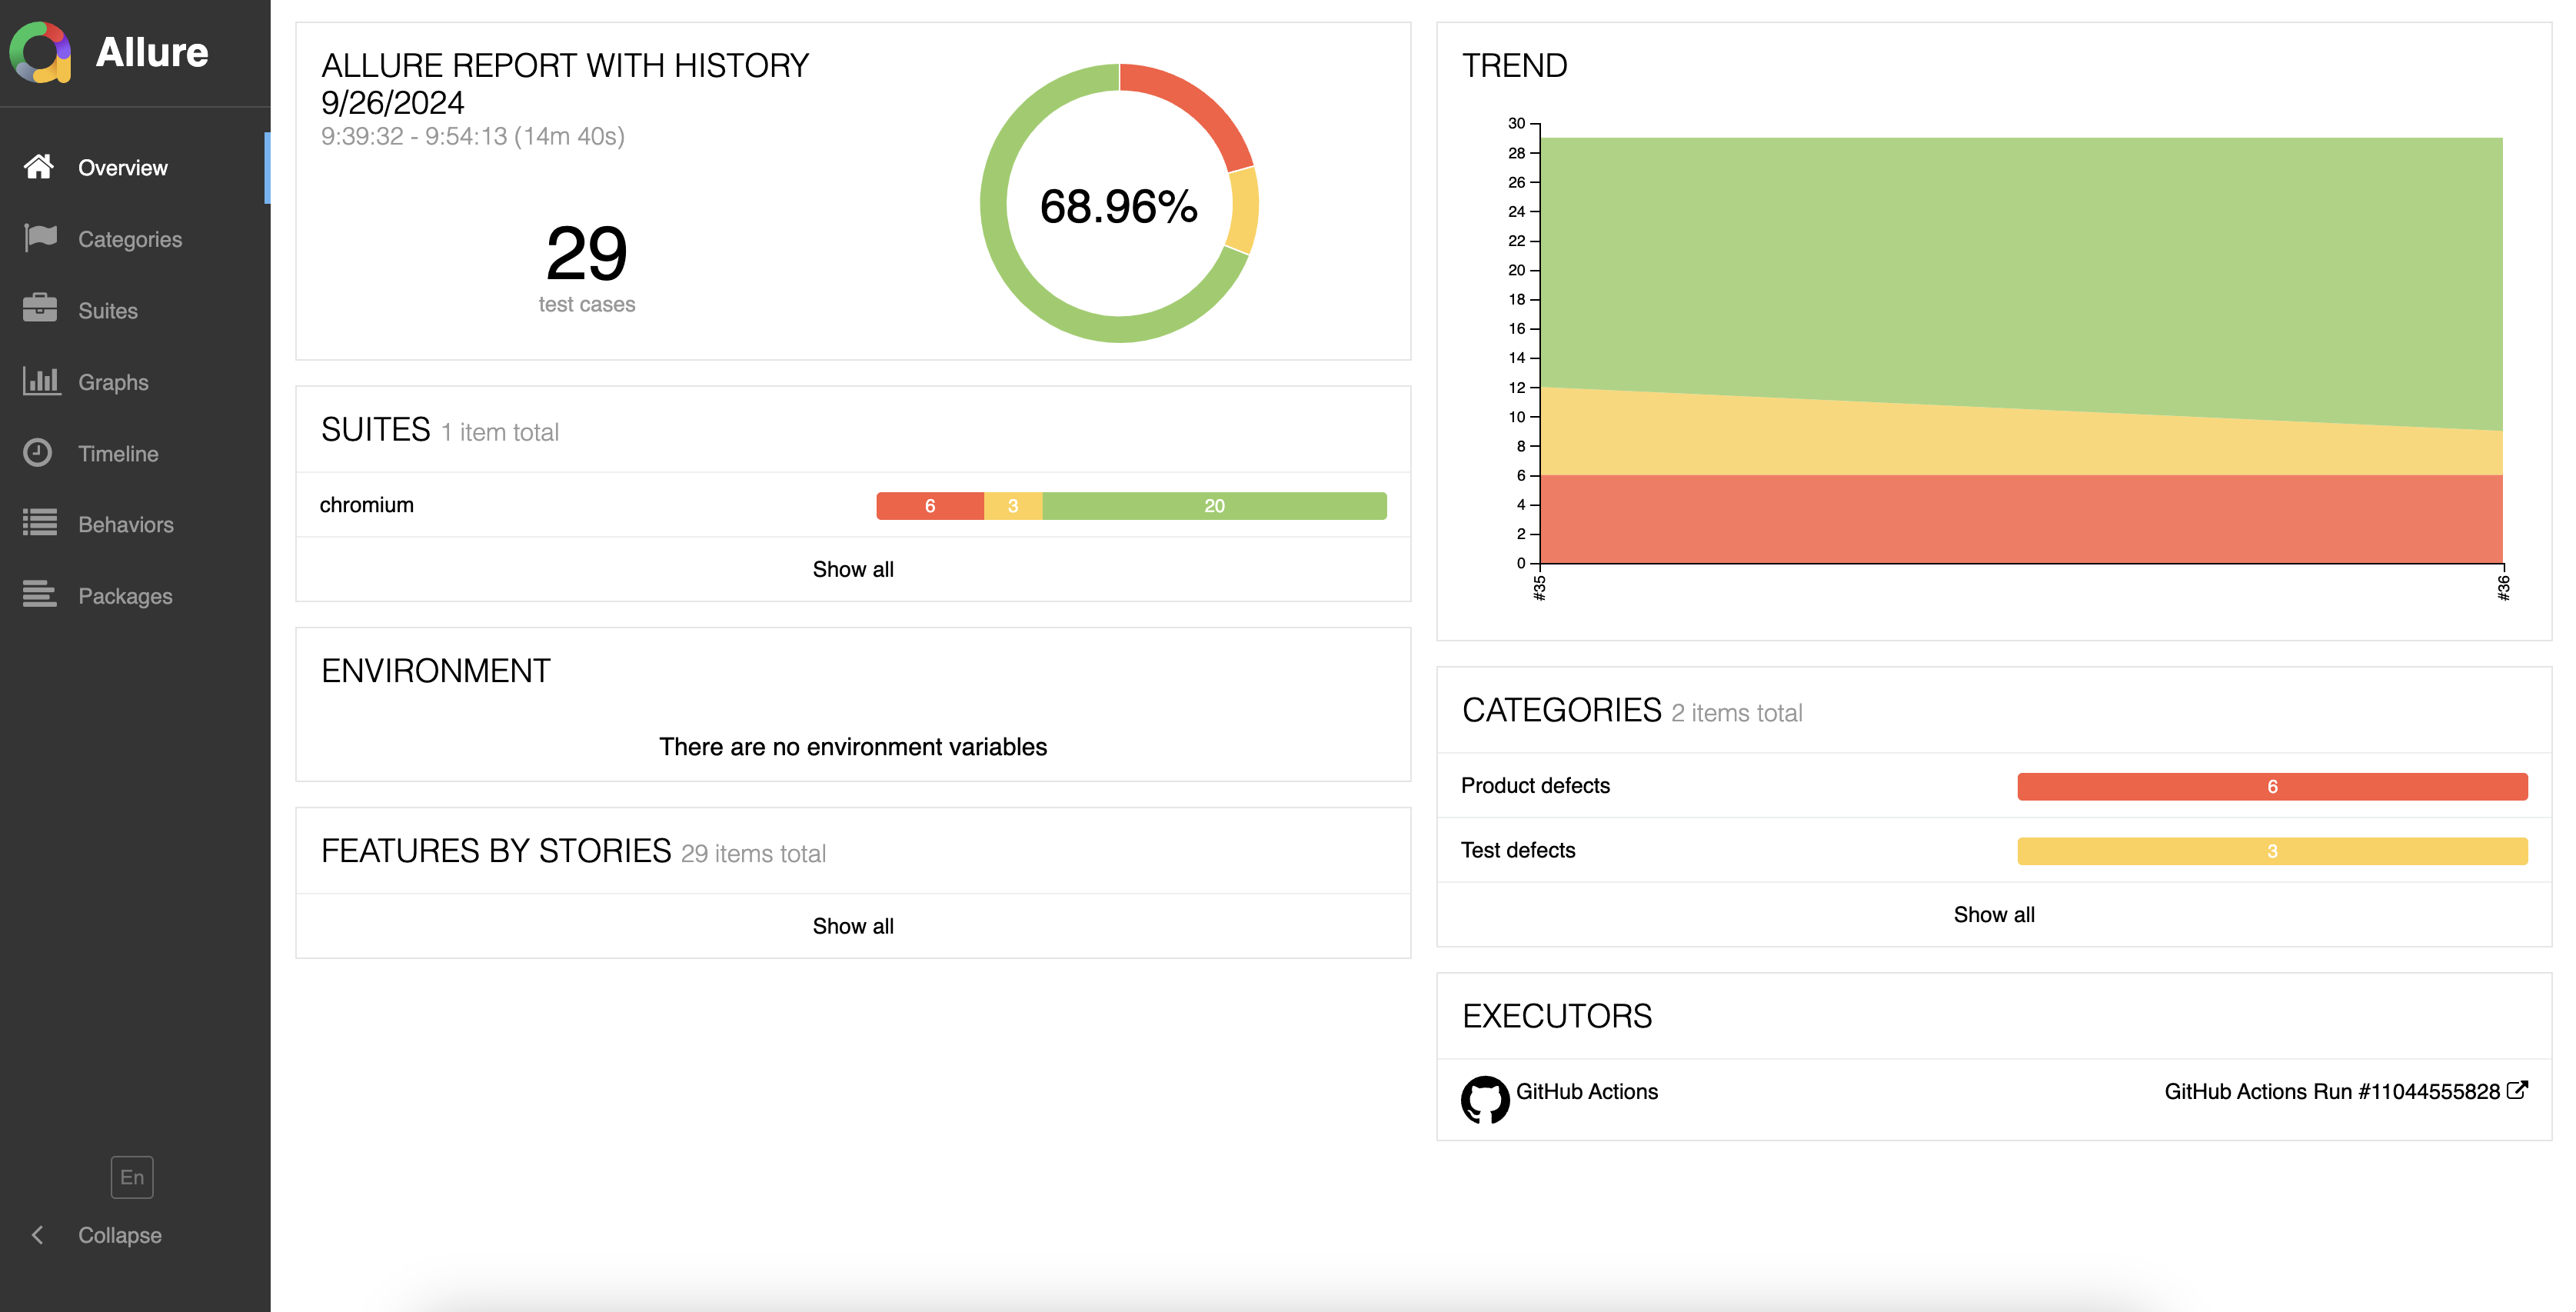 In this allure report dashboard you can see a summary of the percentage when carrying out automation testing, the number of scenarios passed or failed.
 Example :
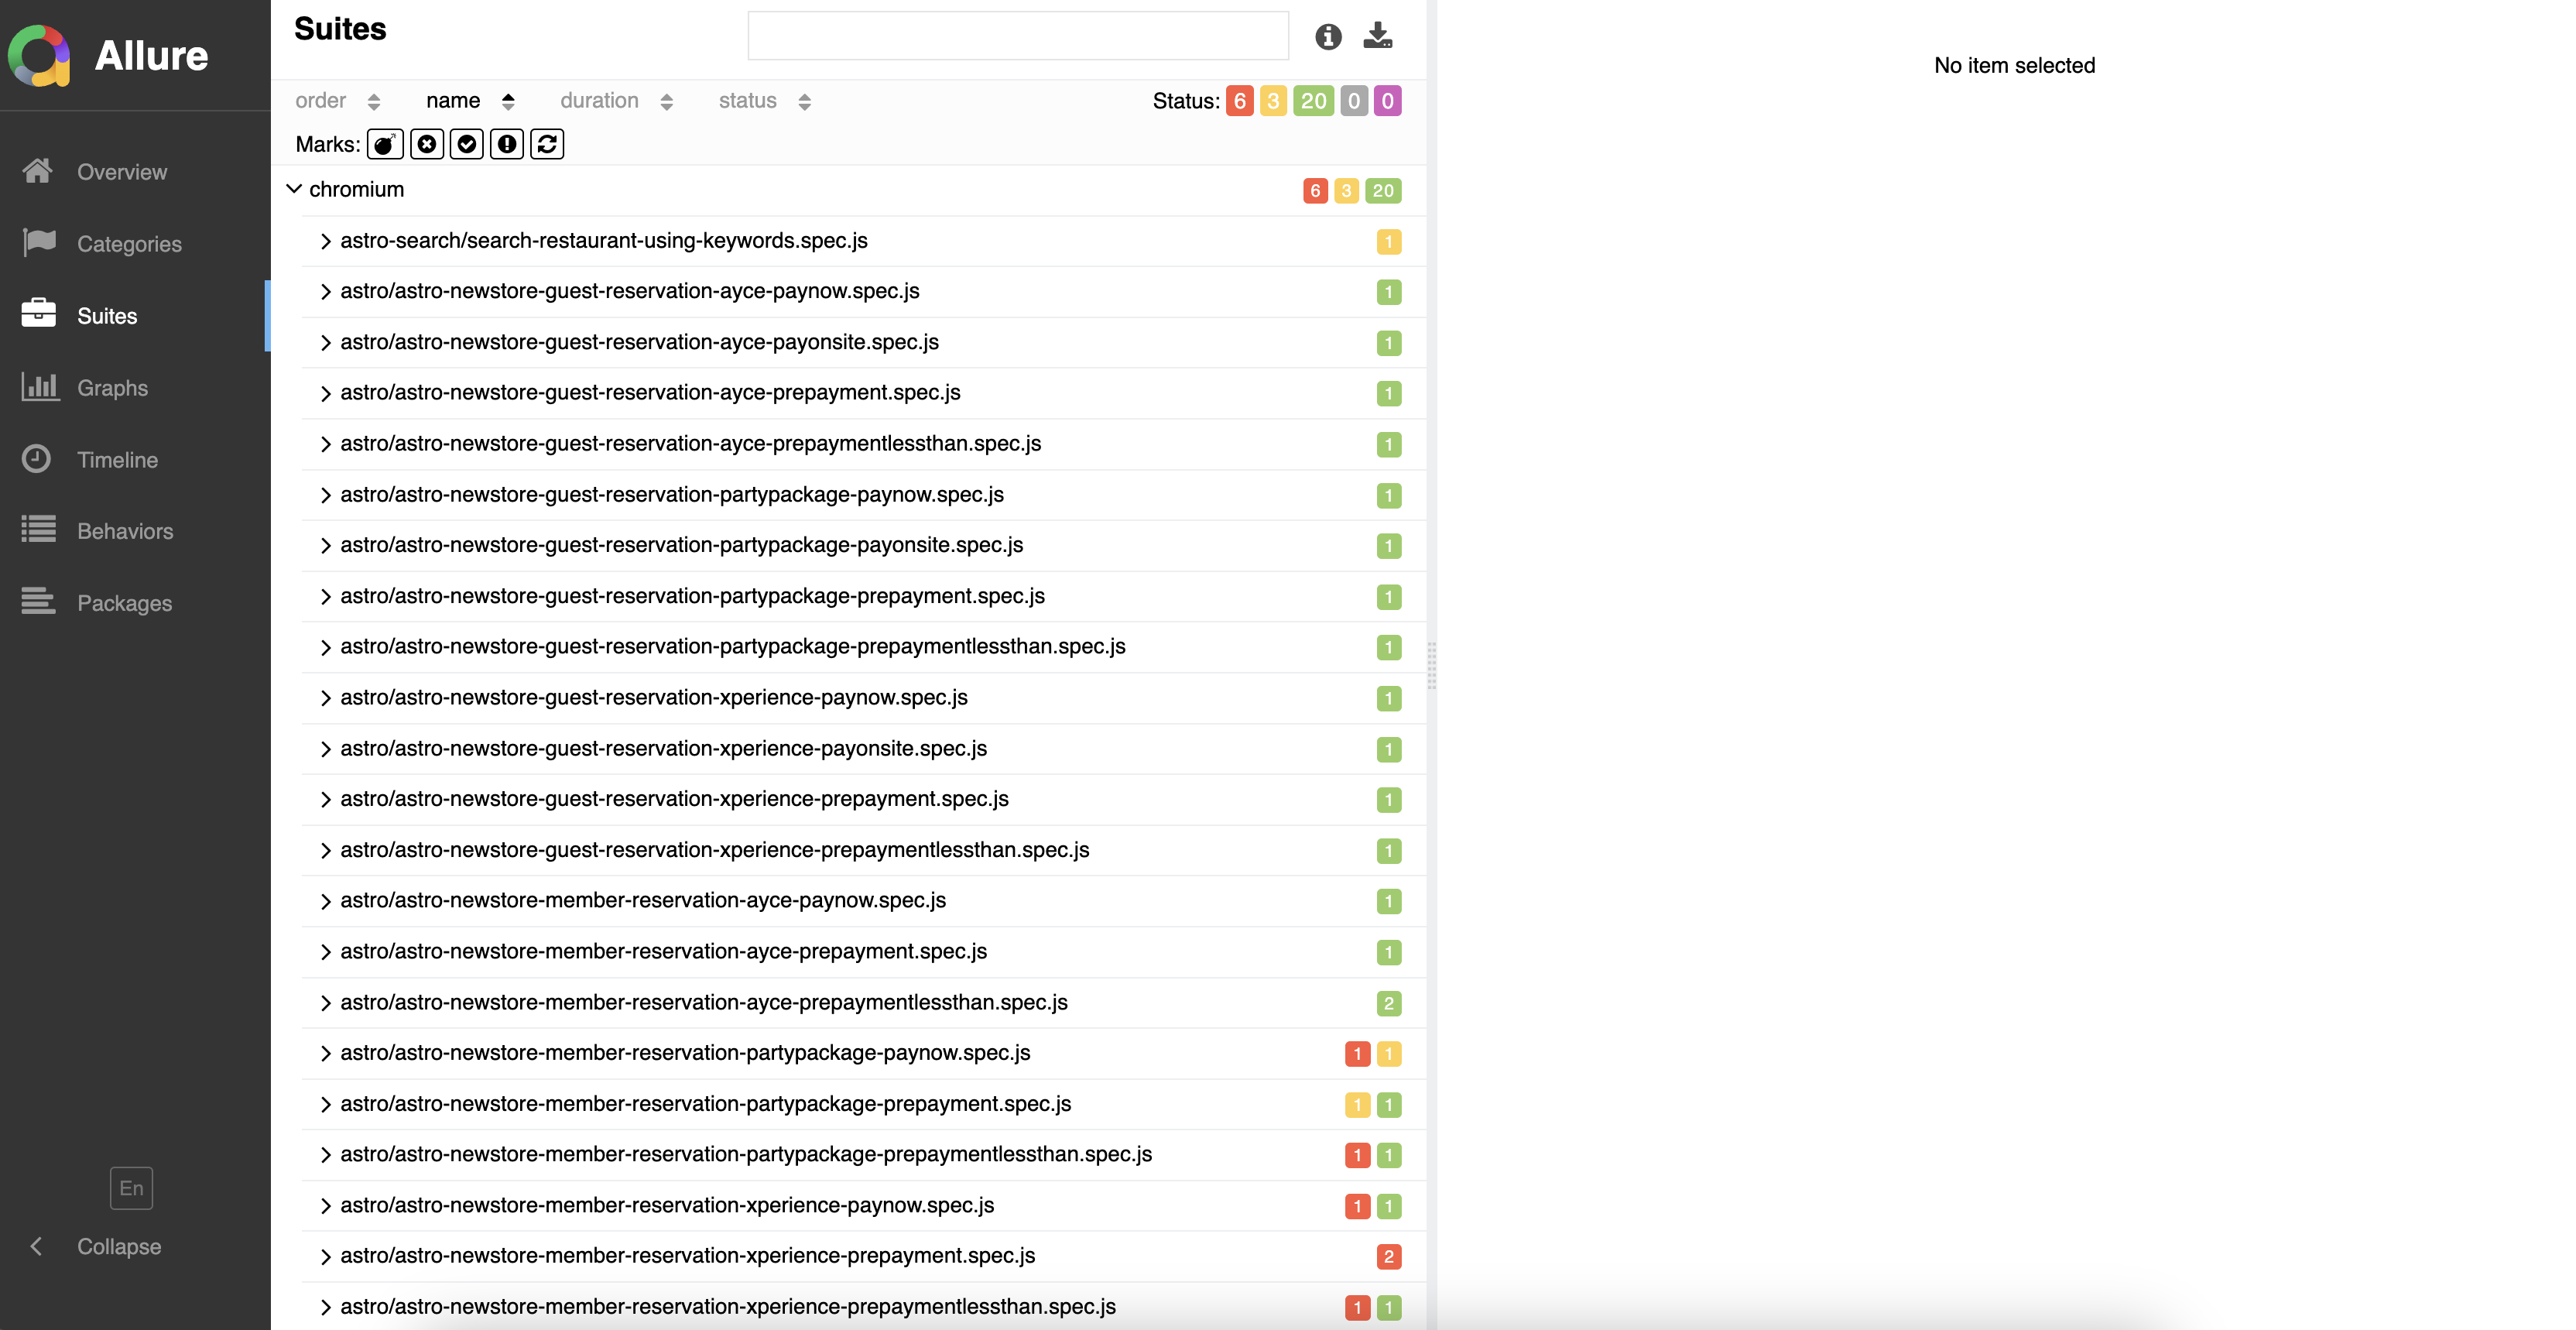
(Suites Overview)
- Suites List (Left Section)
- This section contains the list of all test files executed in the test suite.
- Each test file is labeled by its name (e.g.,
astro/astro-newstore-guest-reservation...), and the number of test cases inside the file is displayed. - Tests are grouped under the Chromium project, meaning that they were executed in a Chromium-based browser.
- You can see a summary of the pass/fail/skipped status for each suite:
- Red (X): Indicates failed tests.
- Green (✓): Indicates passed tests.
- Orange: Indicates skipped or pending tests.
- Summary on Top-Right
- Displays the overall status of the test suite:
- 6 Failed
- 3 Skipped
- 20 Passed
- This gives an at-a-glance understanding of the current health of your test suite.
- Displays the overall status of the test suite:
 Example :
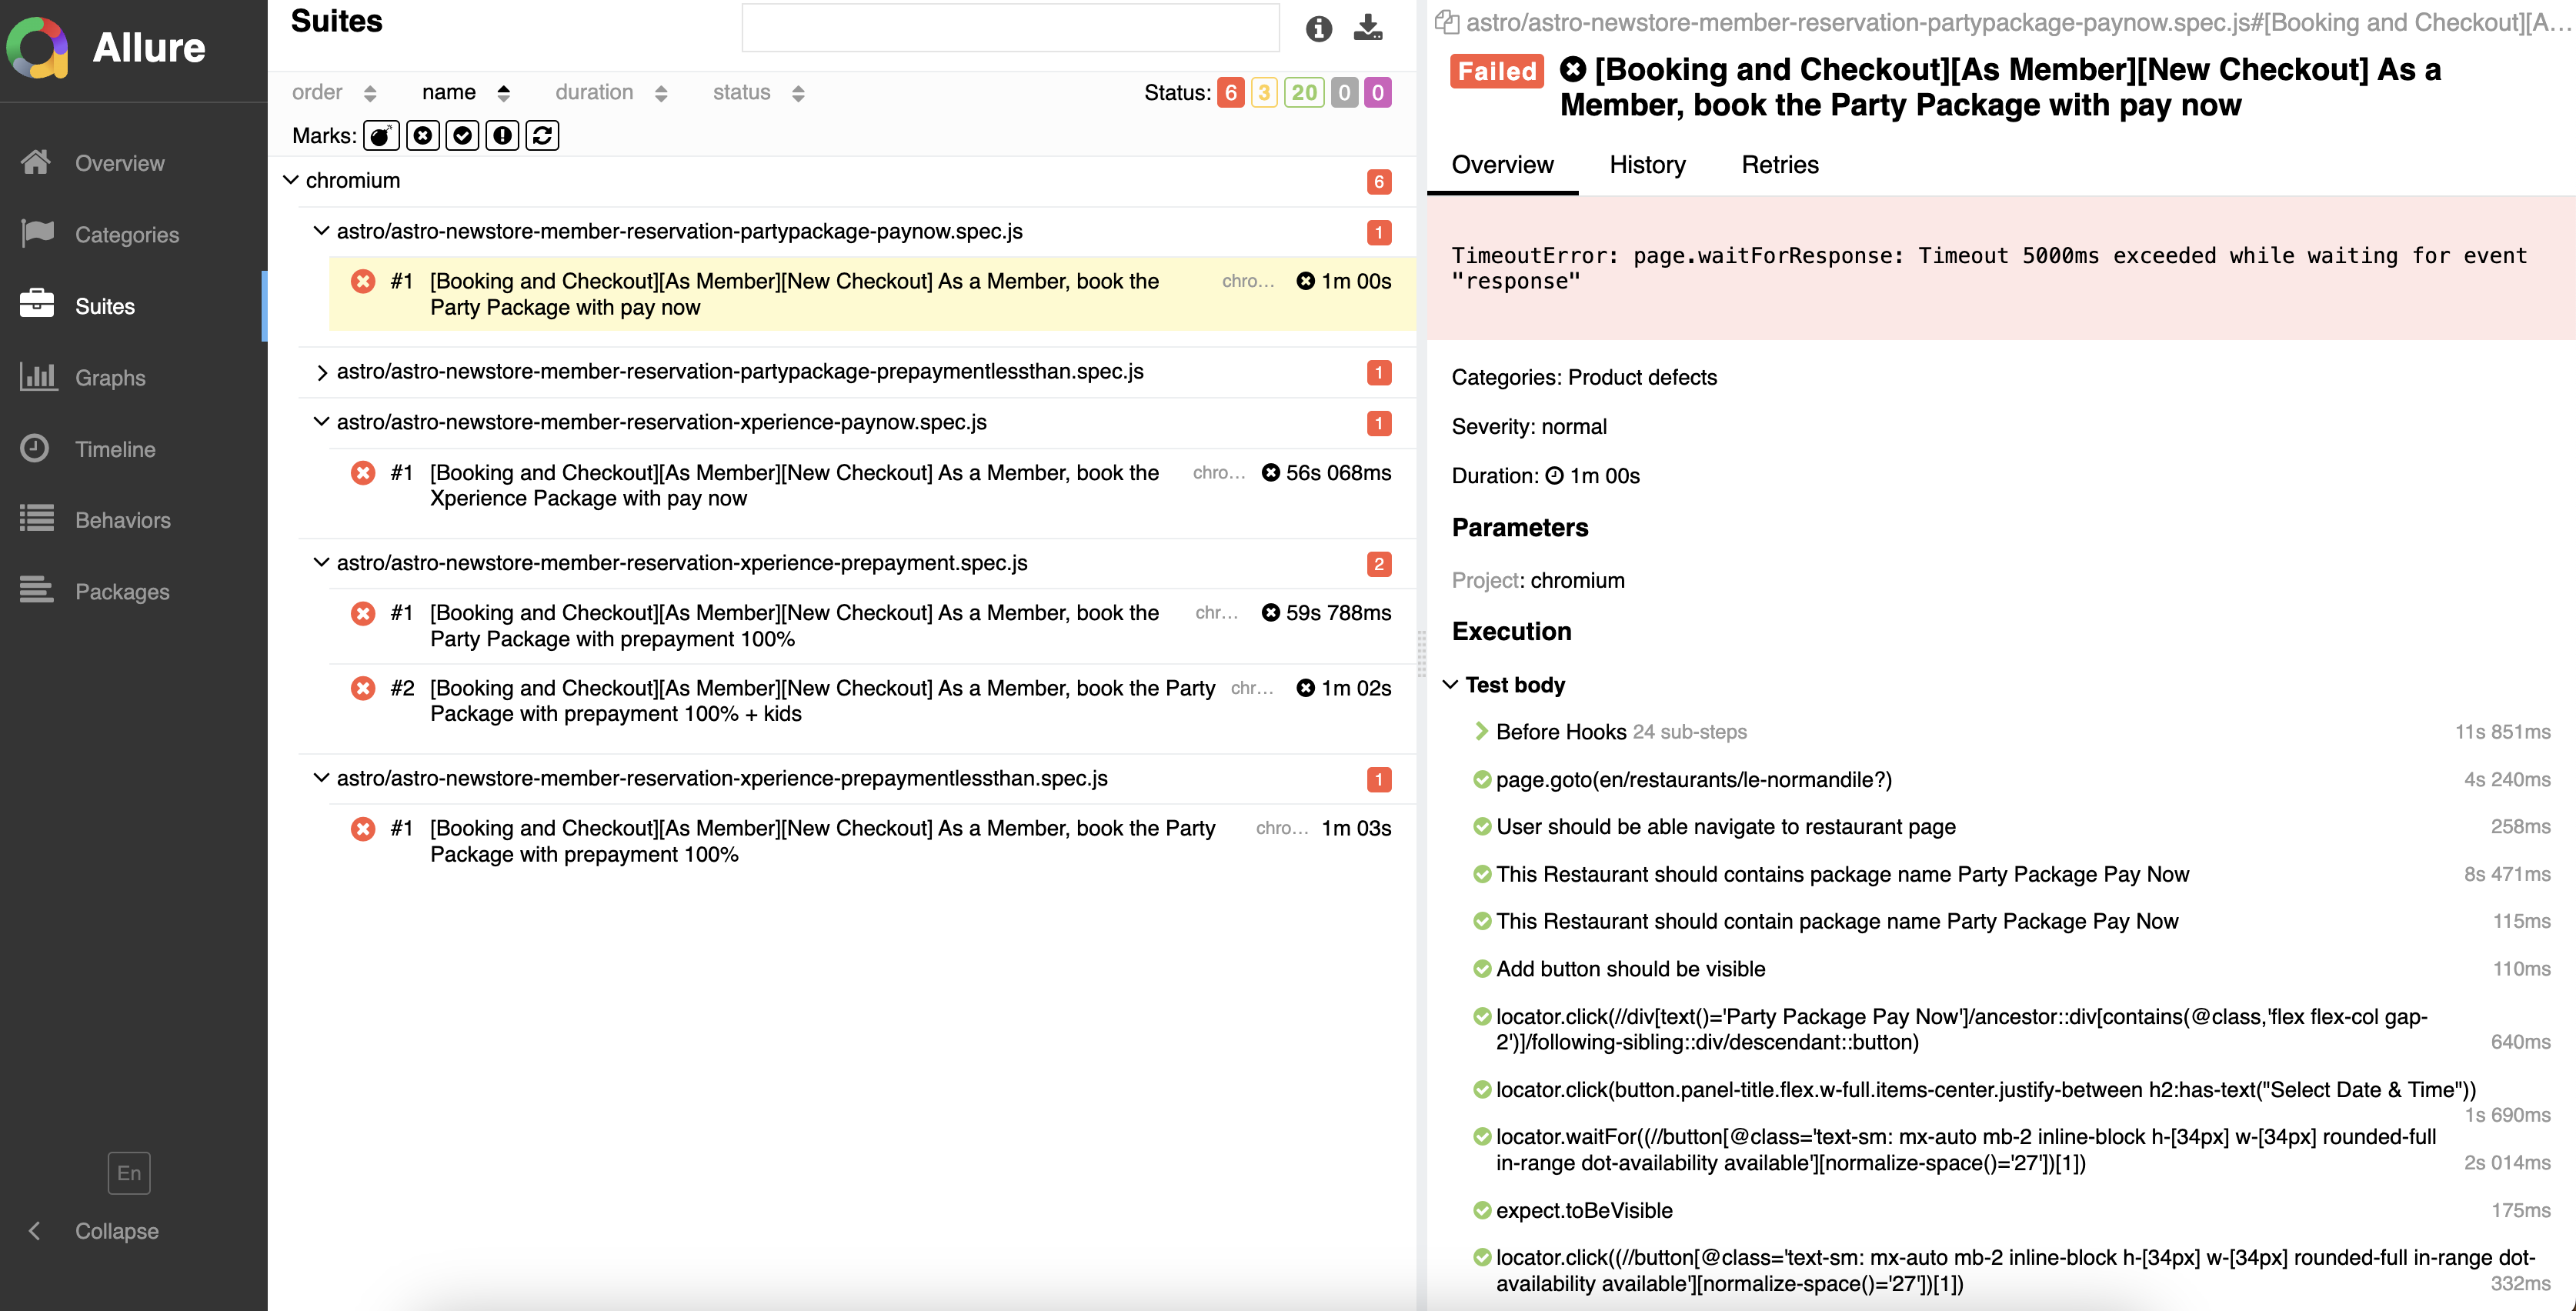
(Failure View - Detailed Test Results)
- Overview Panel (Top-Right Section)
- Shows the failure reason for the specific test. In this case, it is a
TimeoutError: page.waitForResponse, indicating that Playwright was waiting for a response for more than 5000ms (5 seconds) but the response did not arrive within that time. - Categories: This categorizes the failure under Product defects, which helps in classifying the issues.
- Severity: Marked as normal, which indicates the priority or impact of this failure in the test suite.
- Duration: The time taken for this test to fail is shown, which in this case is 1 minute.
- Shows the failure reason for the specific test. In this case, it is a
- Execution Panel (Bottom-Right Section)
- Provides a breakdown of each step executed during the test.
- It details everything from the page navigation, locator actions, such as clicks, and waitFor functions.
- The steps in green indicate that they passed successfully, whereas the final step is likely where the failure occurred.
- The failure happened in the
locator.waitForstep, as seen in the error message (Timeout exceeded while waiting for event "response"). - Each step also includes execution times (e.g.,
4s 240ms,258ms), which shows how long each action took.