Provide two distinct interfaces:
Admin Dashboard – Full view of sentiment data for all restaurants in the platform.Partner Portal – Scoped view of sentiment for one restaurant or specific branches.
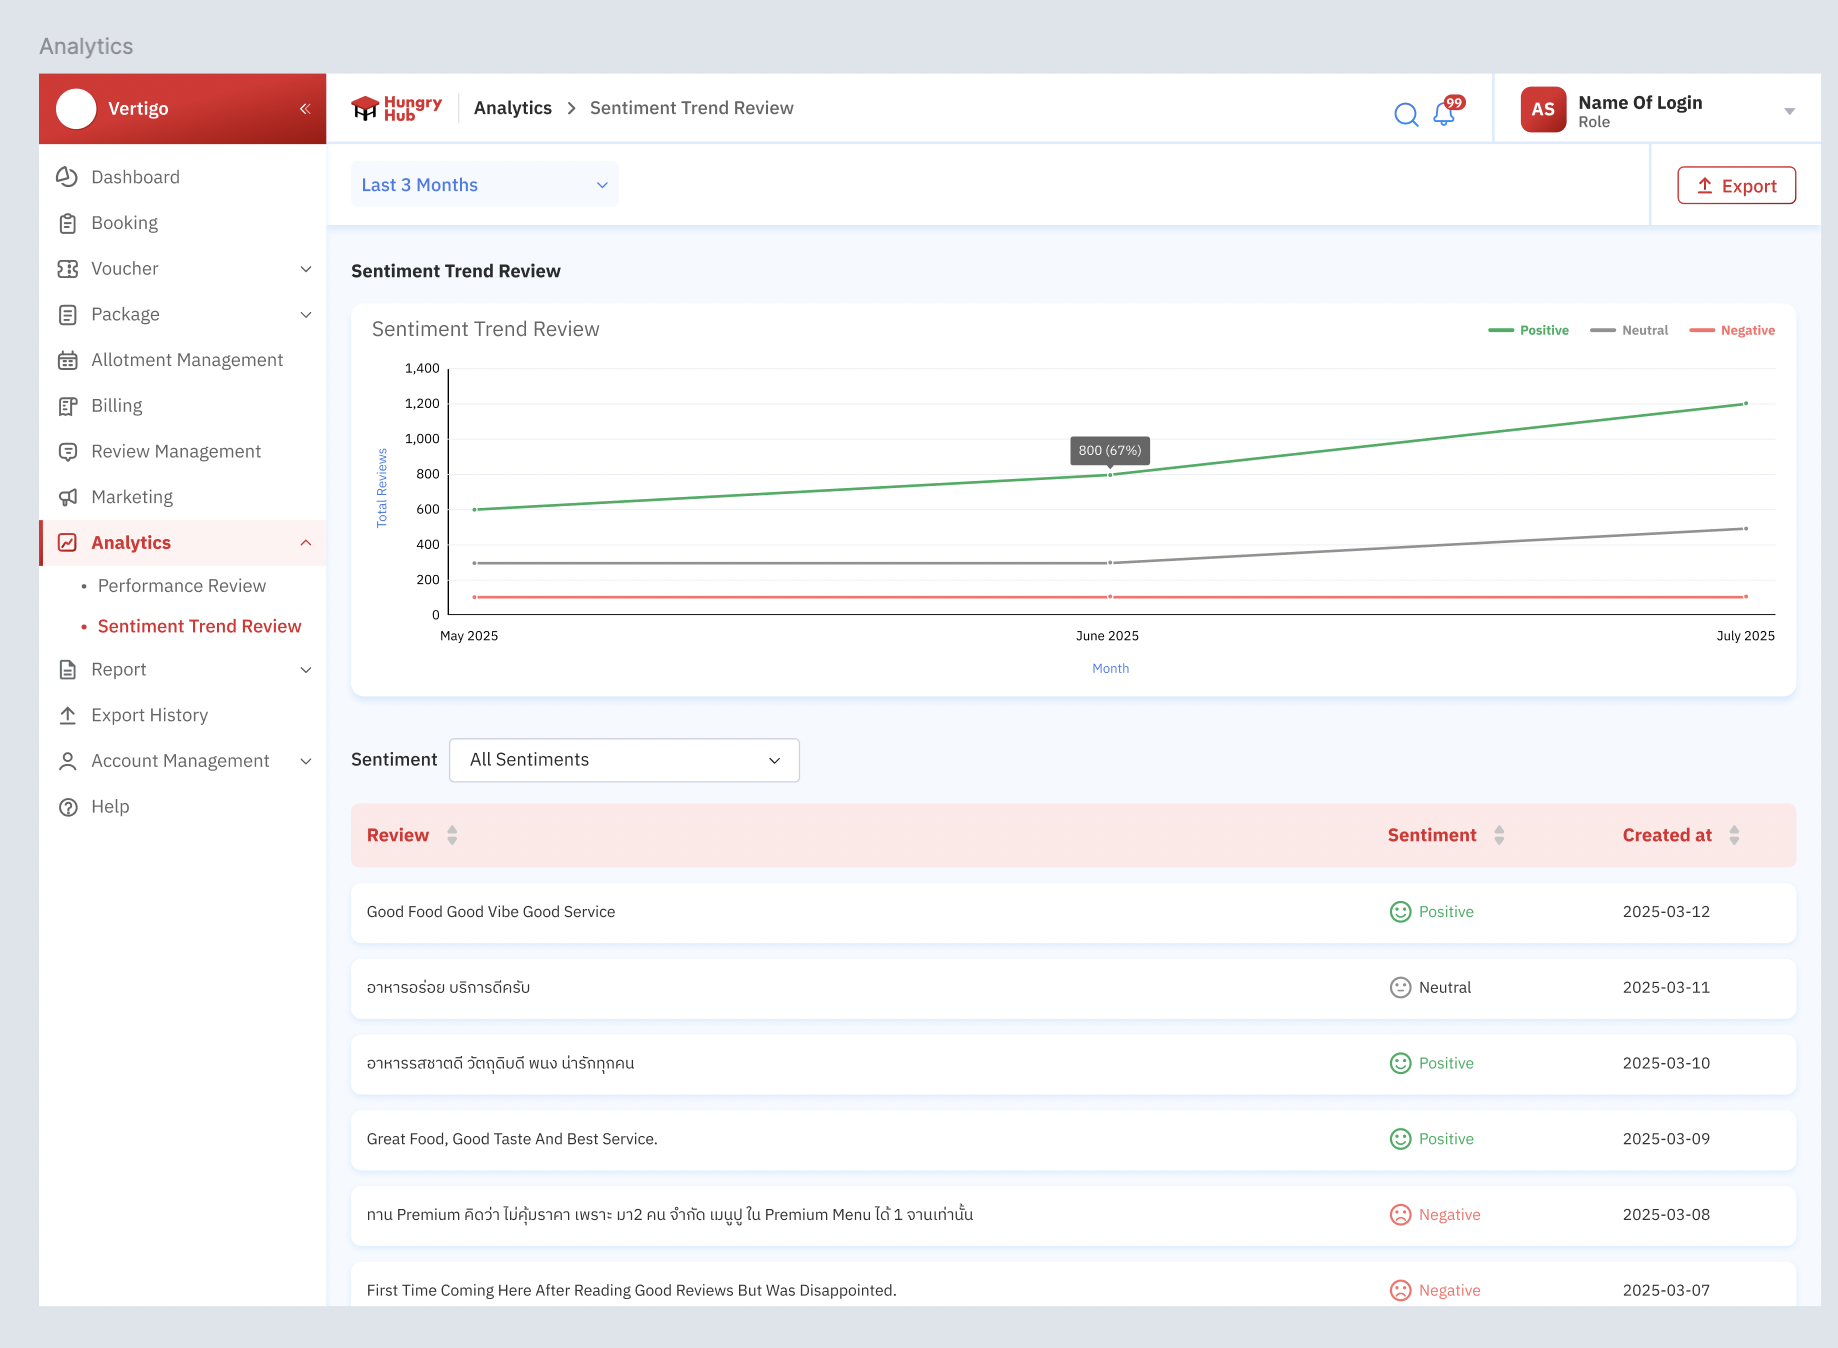
Displays sentiment breakdowns (Positive, Neutral, Negative), trends, and sentiment distribution filters by dynamic time ranges .
Enables internal and partner stakeholders to monitor sentiment performance, detect early warning signs, and celebrate positive momentum with data-driven insights.
Design Link : https://www.figma.com/design/ymdLN2ZKzfI0oyX4kps2GQ/Partner-Portal-Desktop?node-id=16748-70&t=wysc60gqnZV98raF-1
Admins need centralized visibility into customer sentiment trends across all restaurants for timely operational decisions.Restaurant partners need focused sentiment analysis on their restaurants to manage service quality and marketing opportunities.Without structured analytics and granular filters (especially for real-time or weekly insights), sentiment performance is difficult to monitor and react to.
Improve sentiment transparency across HungryHub’s ecosystem.
Enable data-informed operational improvements at both platform and restaurant level.
As an Admin, I want to view real-time (hourly) sentiment trends for today to identify operational issues instantly.
As an Admin, I want to filter sentiment data by Last 7 Days or This Month to compare performance across restaurants.
As an Admin, I want to see a Last 3 Months view to compare sentiment trends across quarters.
As a Restaurant Partner, I want to track daily sentiment changes over the Last 30 Days to spot shifts in service perception.
As a Restaurant Partner, I want to monitor hourly sentiment for today to detect and act on customer dissatisfaction fast.
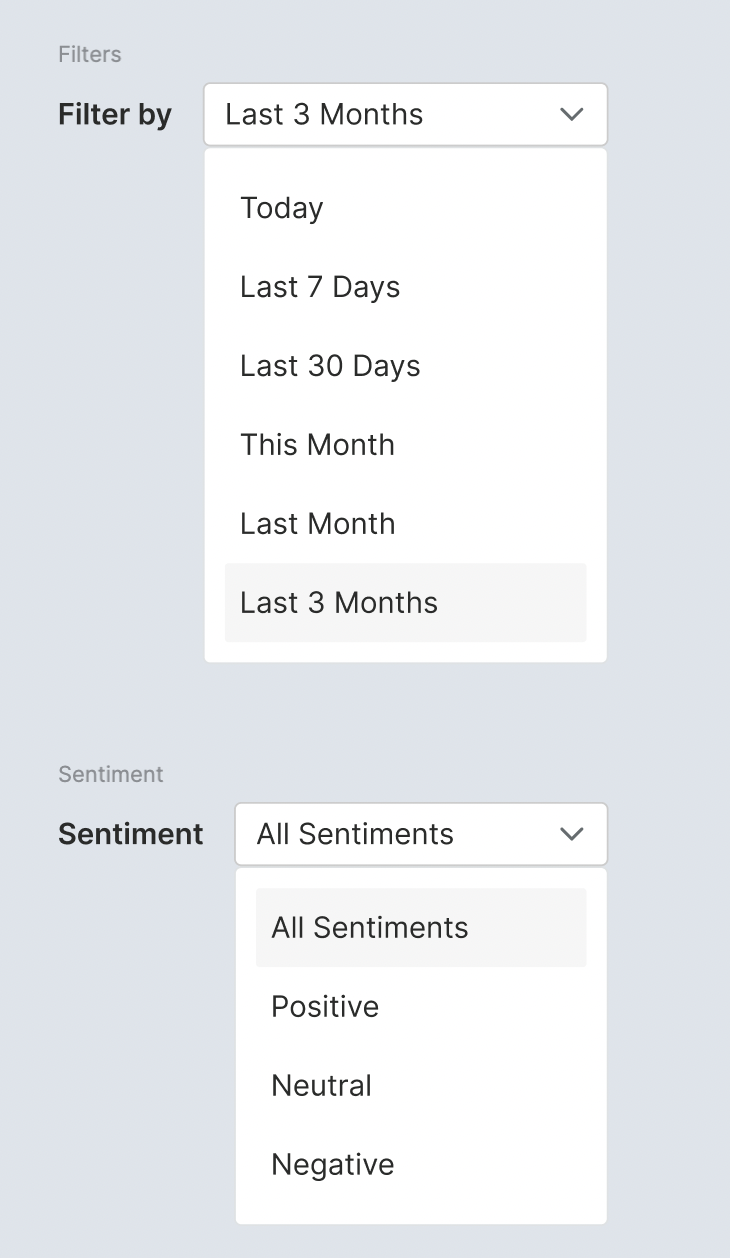
Platform → Partner Portal and Admin Dashboard Sentiment classification display (Positive / Neutral / Negative) → All Sentimens by defaultDynamic time range filter with presets: same with existing Private (https://app.clickup.com/9003122396/docs/8ca1fpw-30456/8ca1fpw-53296 )
Today (hourly) → Full day, not depends on the open and close time
Last 7 Days (daily)
Last 30 Days (daily)
This Month (daily)
Last Month (daily)
Last 3 Months (monthly granularity) → Default
Empty reviews excluded from sentiment classification.Trend line chart that adjusts its granularity automatically based on the selected time range.Ability to switch between branches in Partner view.
Tooltip display on charts (e.g., counts, % sentiment per bar).
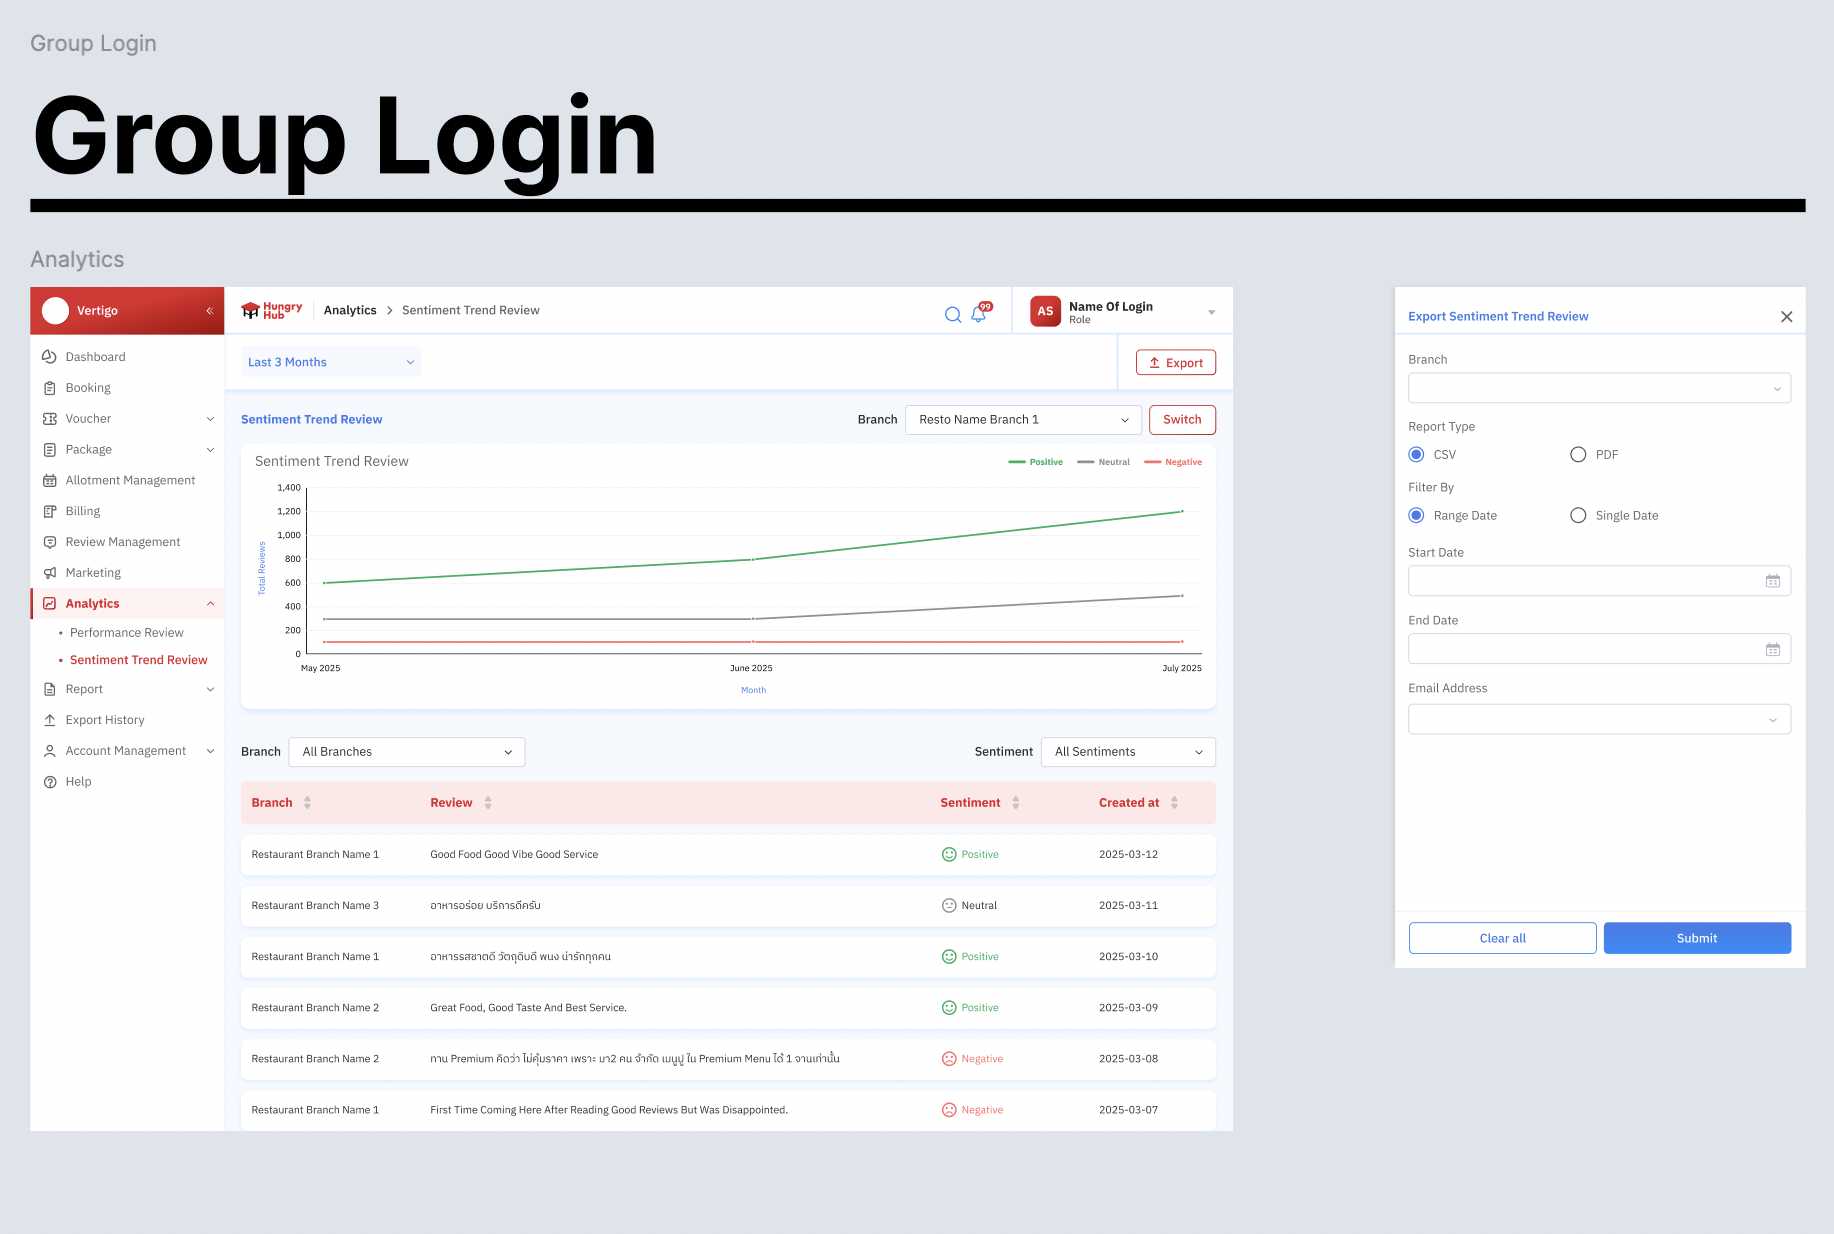
Export sentiment report data as Excel or PDF .
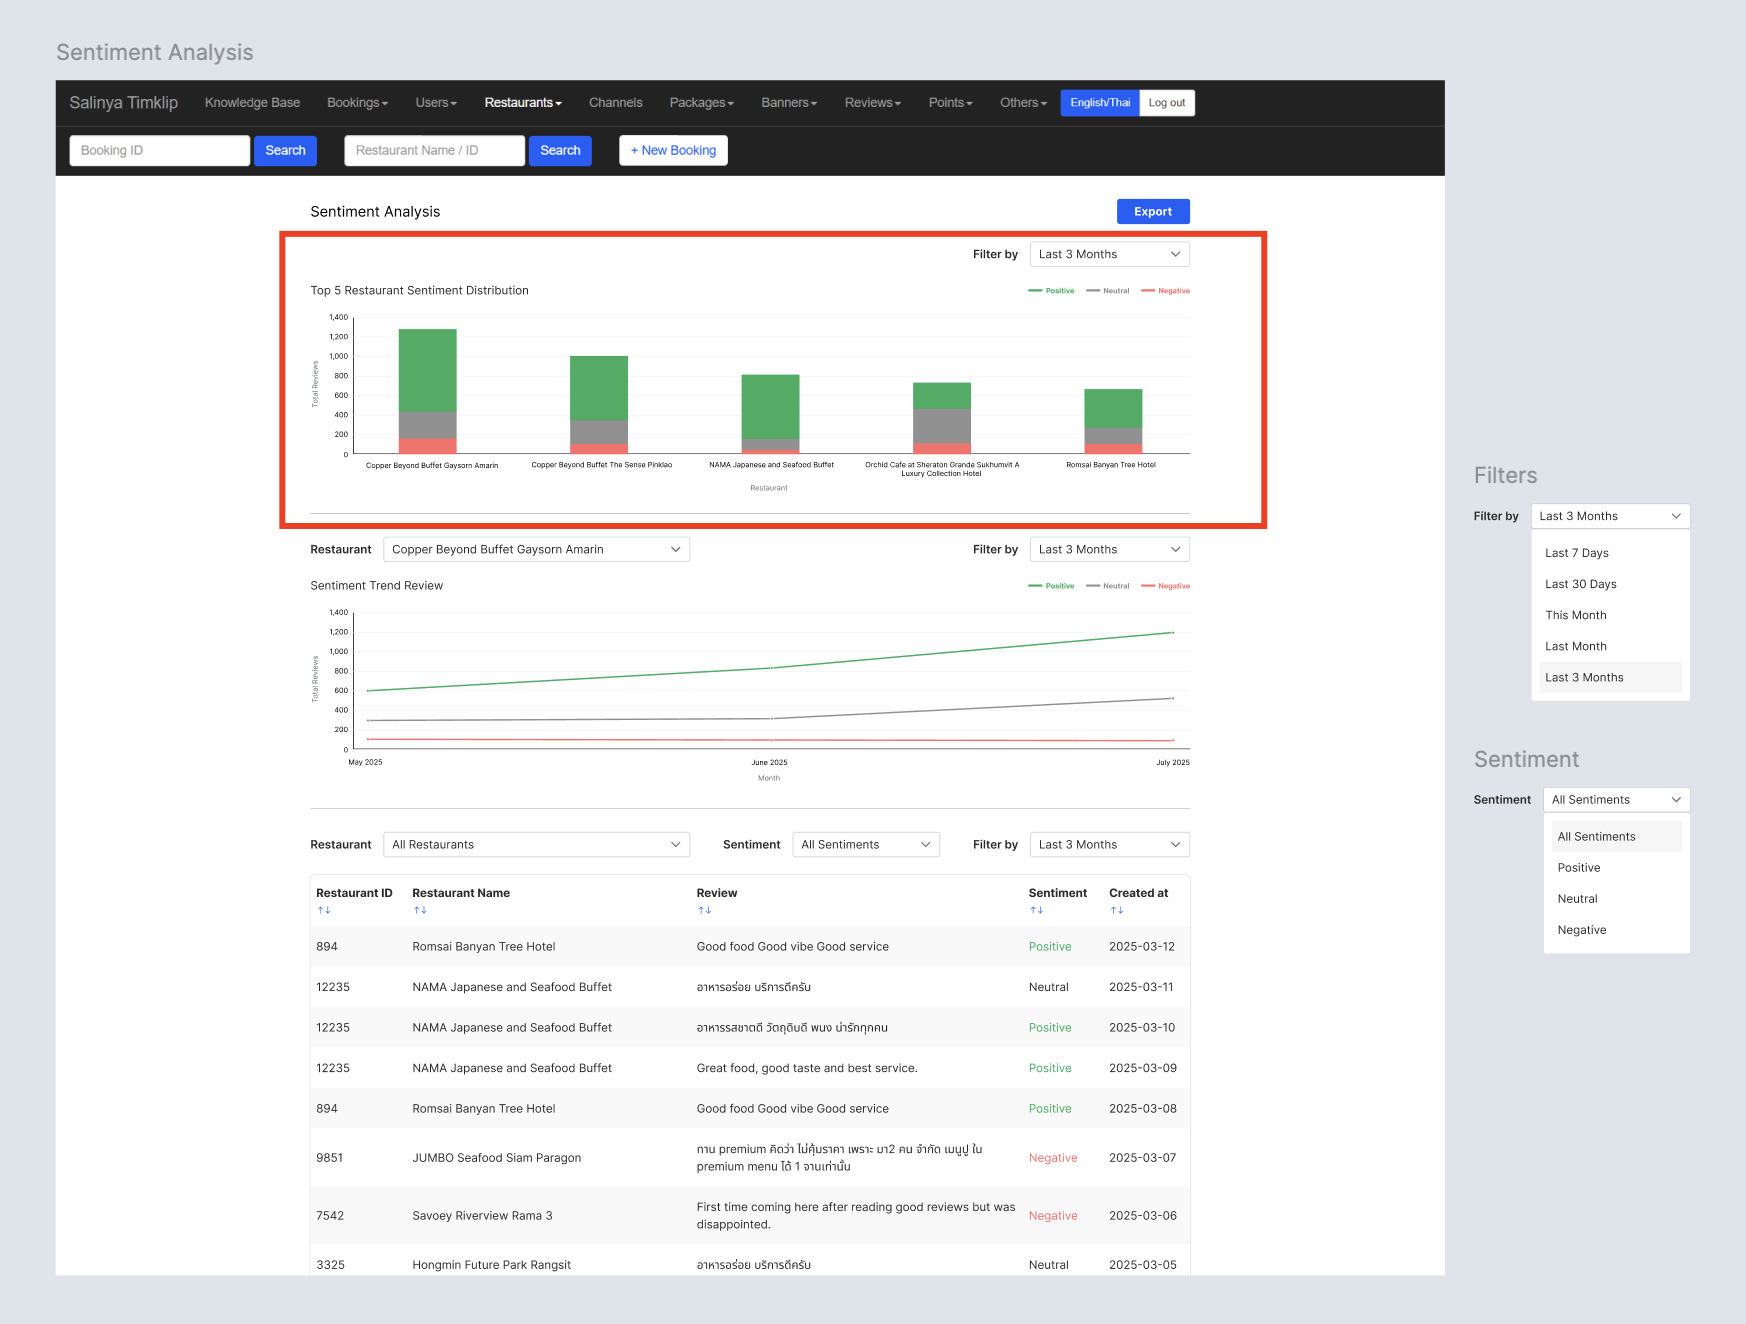
Admin Dashboard UI :
Grid of restaurants with visual stacked sentiment bars and labels → Top 5 restaurant with the most review
Filter by Last 3 Months by default
Sort/filter by sentiment volume or trend change.
Filter by : Last 3 Months by default
Sentiment : All Sentiments by default
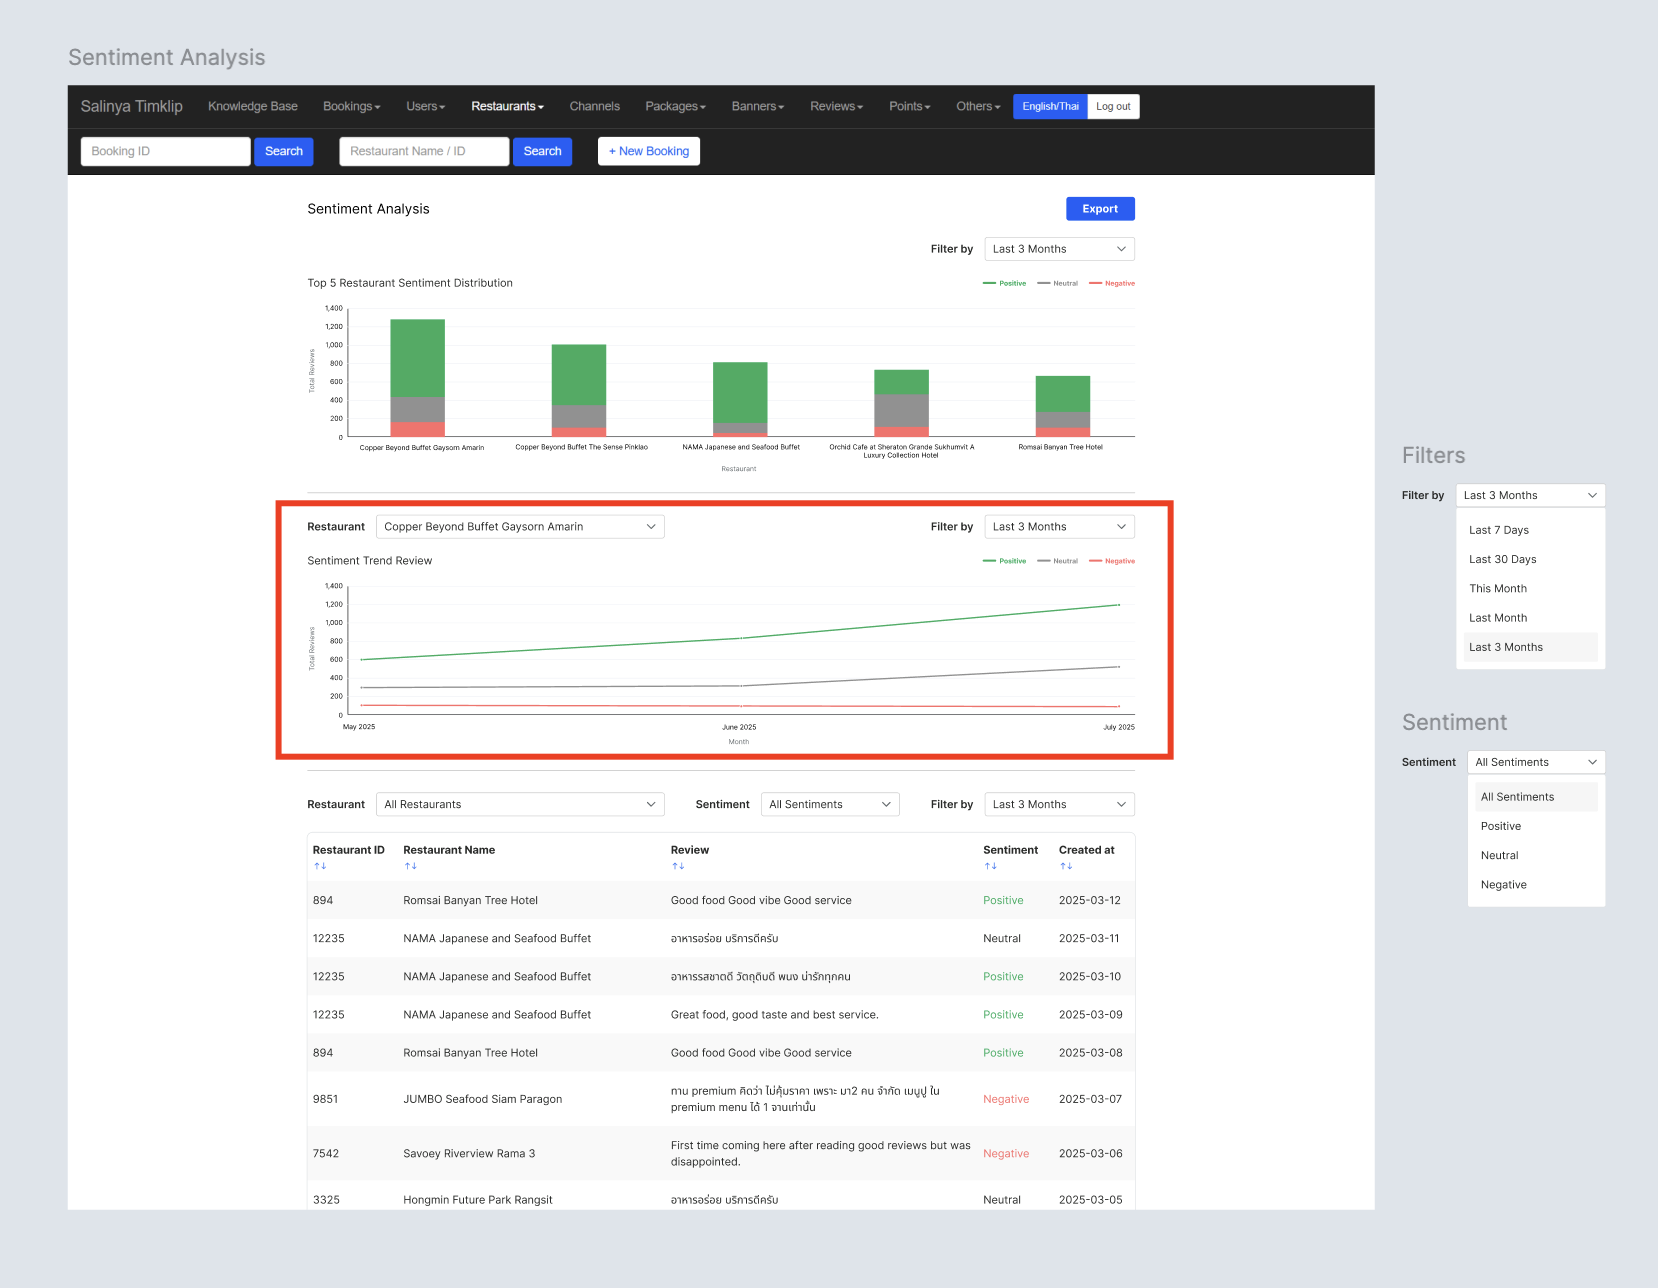
Sentiment Trend review → need to select a restaurant first
Select Restaurant by default
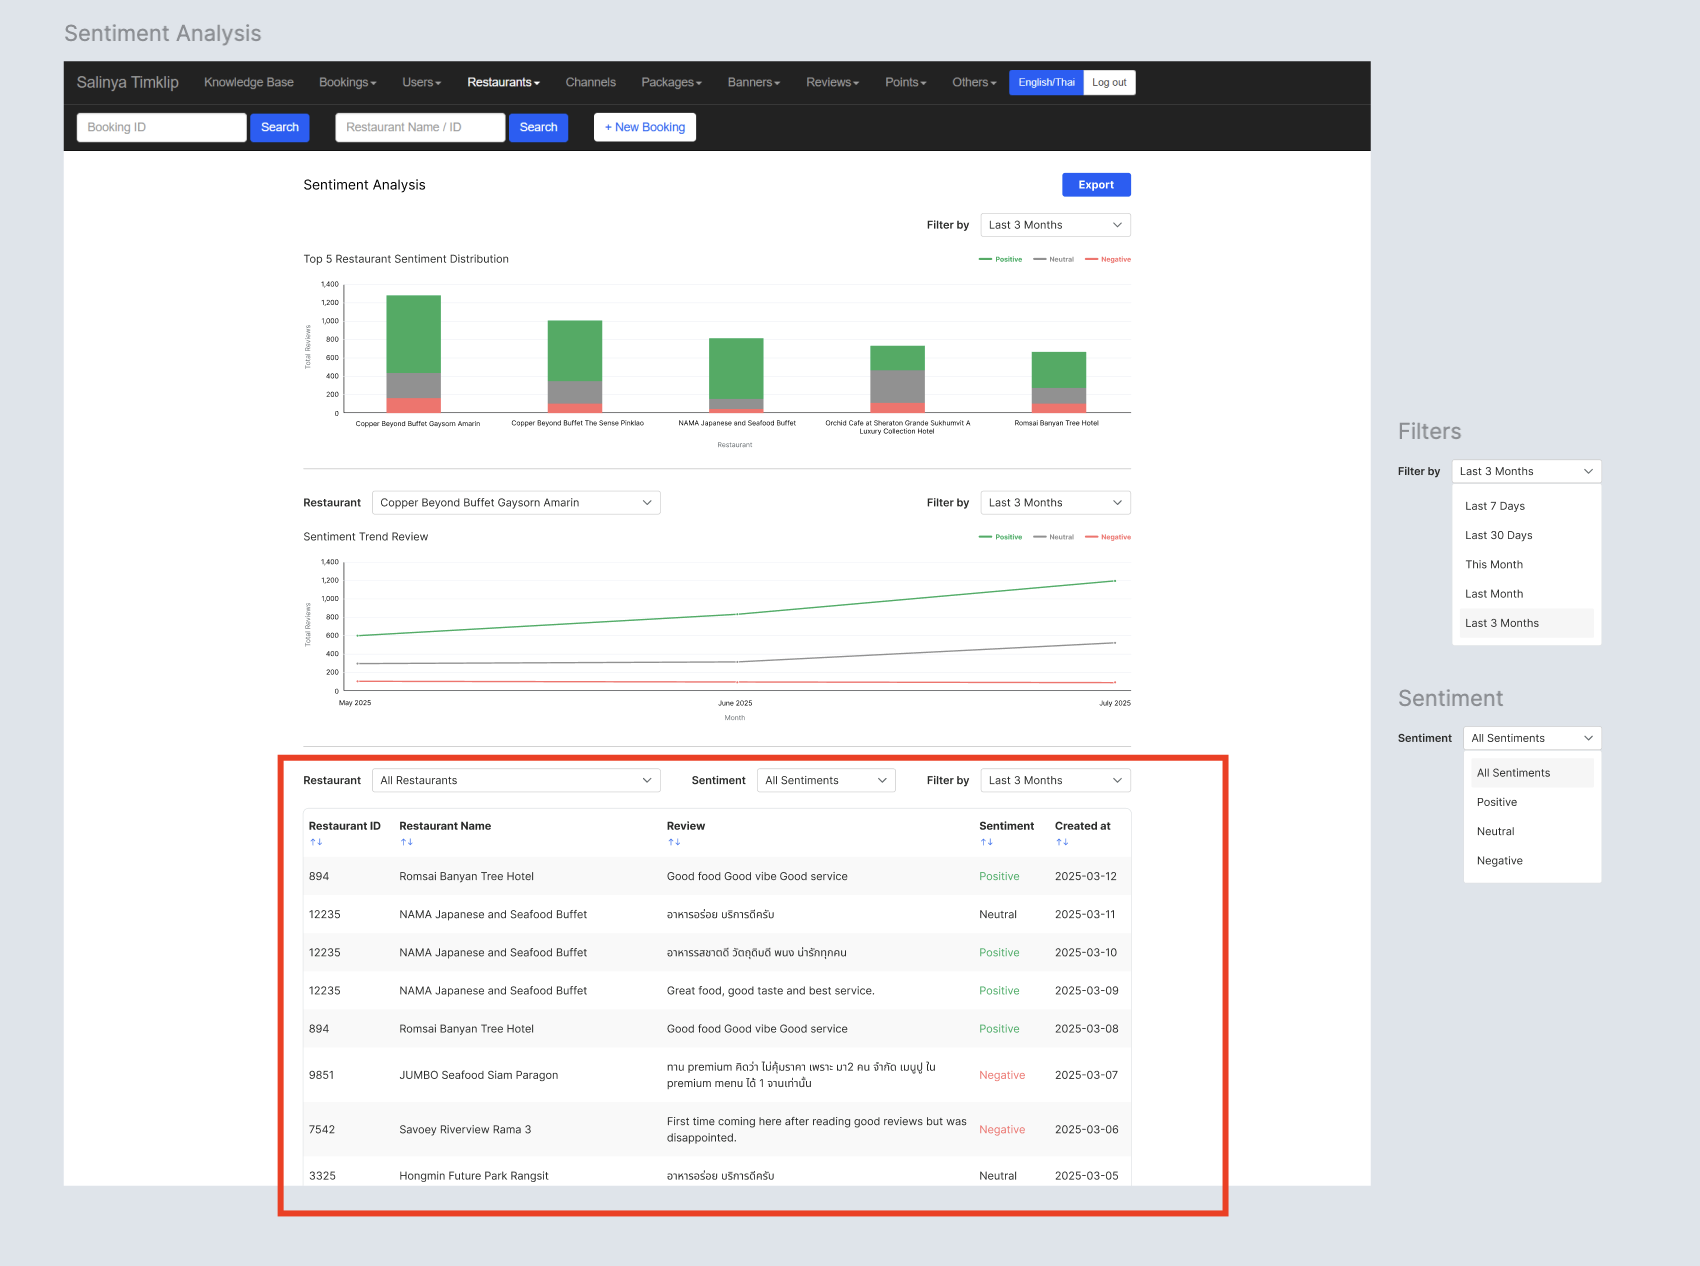
Sentiment table of all restaurants
Can export by Excel or PDF
Partner Portal UI :
Same with admin dashboard, but only display restaurant or branches
Add subpage inside Analytics page
Sort/filter by sentiment volume or trend change.
Filter by : Last 3 Months by default
Sentiment : All Sentiments by default
Individual Login
Group Login
Sentiment Trend review only can select specific branch (Restaurant A, Restaurant B and so on). can't all branches at the same time
View all sentiment reviews. can see All branches or specific branch
Accessibility :
ARIA support, keyboard navigation, and WCAG-compliant color contrasts.
Use iconography and patterns for sentiment (not color only).
Responsive Design :
Support mobile web view and responsive resizing for smaller viewports.
Performance :
Ensure load time < 2s for 3 months of data across hundreds of restaurants.