Benchmark
Problem
- Restaurants lack visibility into how well they're performing compared to similar or competing restaurants.
- No Clear Benchmarks = No Motivation or Direction
Goal
- Motivate restaurants to improve performance through transparent, comparative insights.
- Encourage restaurants to align with market trends.
- Promote healthy competition within similar categories.
- Provide partners with data-driven decision support.
Requirements
Default Data Display
- Default Range:
- Show the last 6 complete months (e.g., if current month is May, show Nov–Apr).
- Show the last 6 complete weeks, based on date selected (e.g., if selected date is June 3 2025, show the complete weeks from
June 3 - June 9,June 10 - June 16,June 17 - June 23,June 24 - June 30,July 1 - July 7,July 8 - July 14.
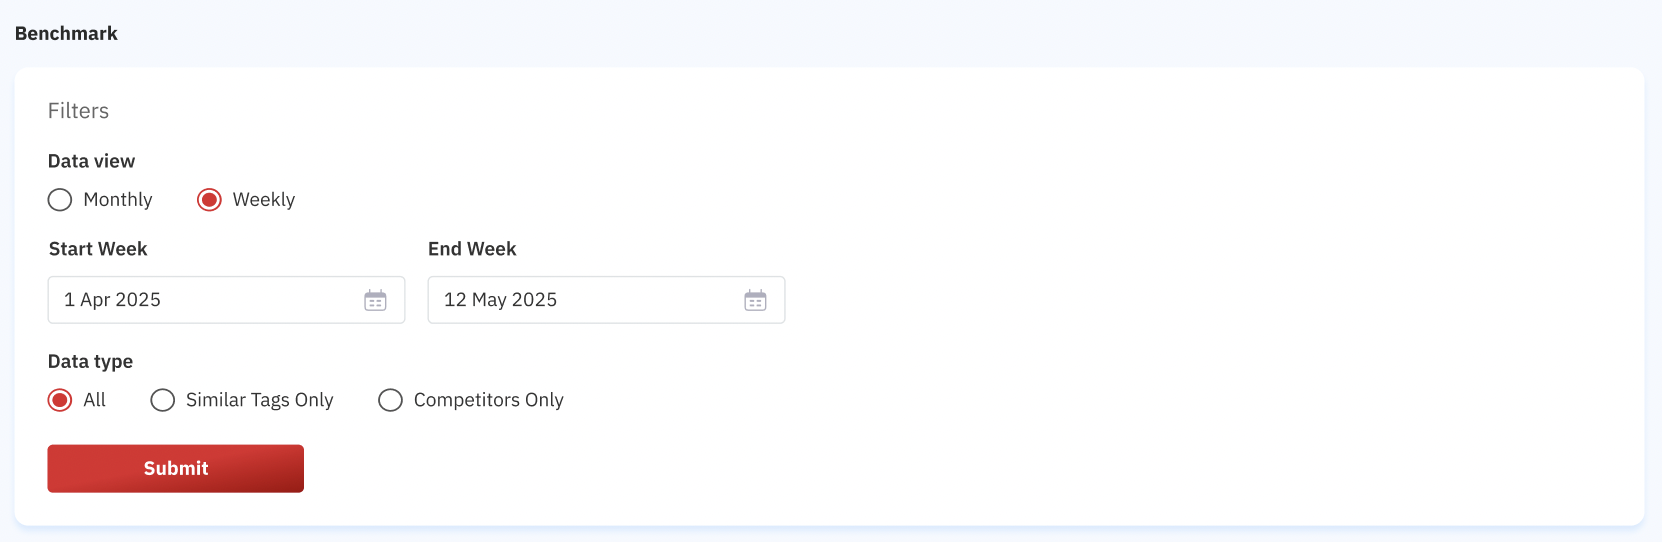
- Custom Range: Allow users to select any continuous 6-month/week period via date picker (max 6 months or weeks).
- Minimum 2 months or weeks
- Maximum 6 months or weeks
- Data View: Allow users to select the data by monthly or weekly
- Data Type: Percent change of performance over time.
Calculation Logic
- Comparison Base:
- Always compare all months against the oldest month in the selected range.
- Always compare all weeks against the oldest week in the selected range.
- Formula:
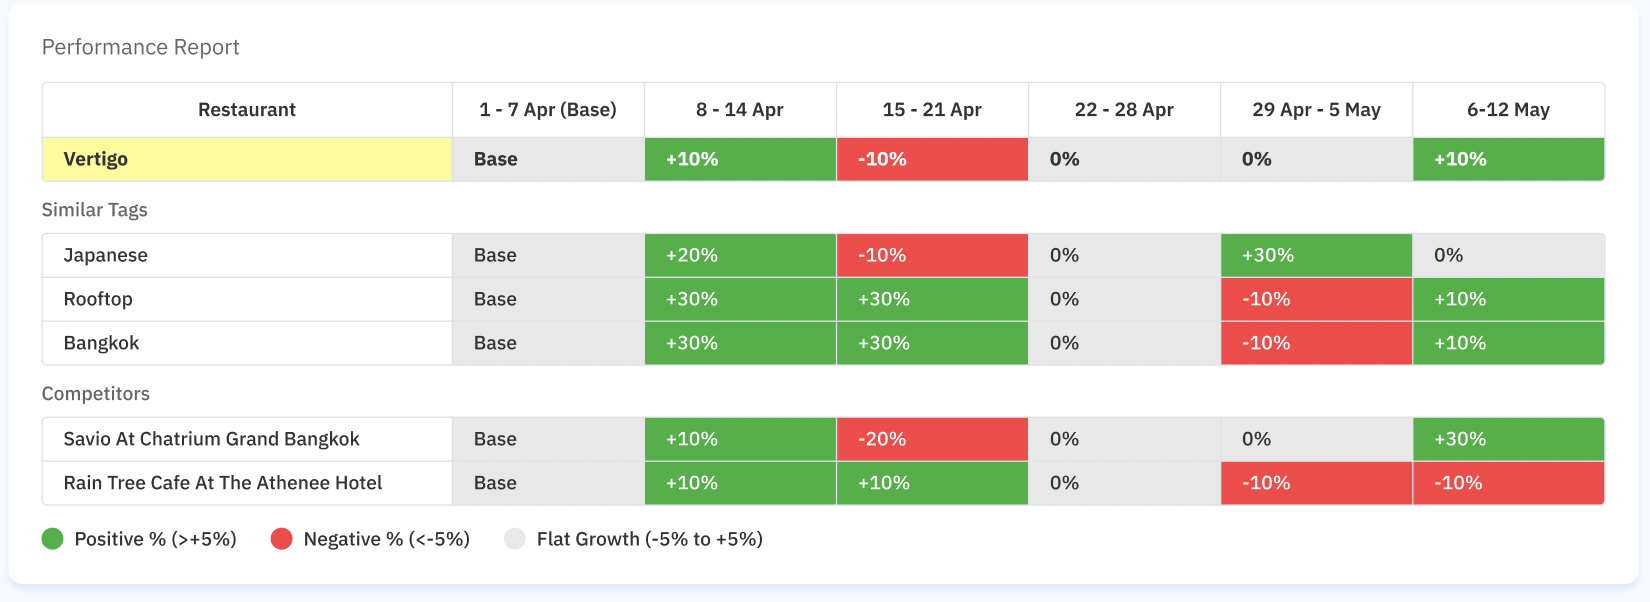
- Performance Report For comparing the growth percentage in each restaurant
- Monthly=
((Current Month GMV−Base Month GMV)/Base Month GMV)×100 - Weekly=
((Current Week GMV−Base Week GMV)/Base Week GMV)×100 - Average Spend Per Person Report For comparing the spend per person in each restaurant (use covers quantity)
- Monthly =
((Current Month avg spend−Base Month avg spend)/Base Month avg spend)×100
- Special Rule for Base Month/Week: Since comparison is always to the base month/week, its value will always show as
"Base"instead of0%to reduce confusion.
Groupings
- Similar Tags Group:
- Automatically grouped based on the primary restaurant tags: primary cuisine, primary dining style and primary location (e.g., “Japanese”, “Rooftop”, "Bangkok").
- Use the average of all restaurants on each tag
- Use the similar tags that attached to restaurant selected → Group Login
- Automatically grouped based on the primary restaurant tags: primary cuisine, primary dining style and primary location (e.g., “Japanese”, “Rooftop”, "Bangkok").
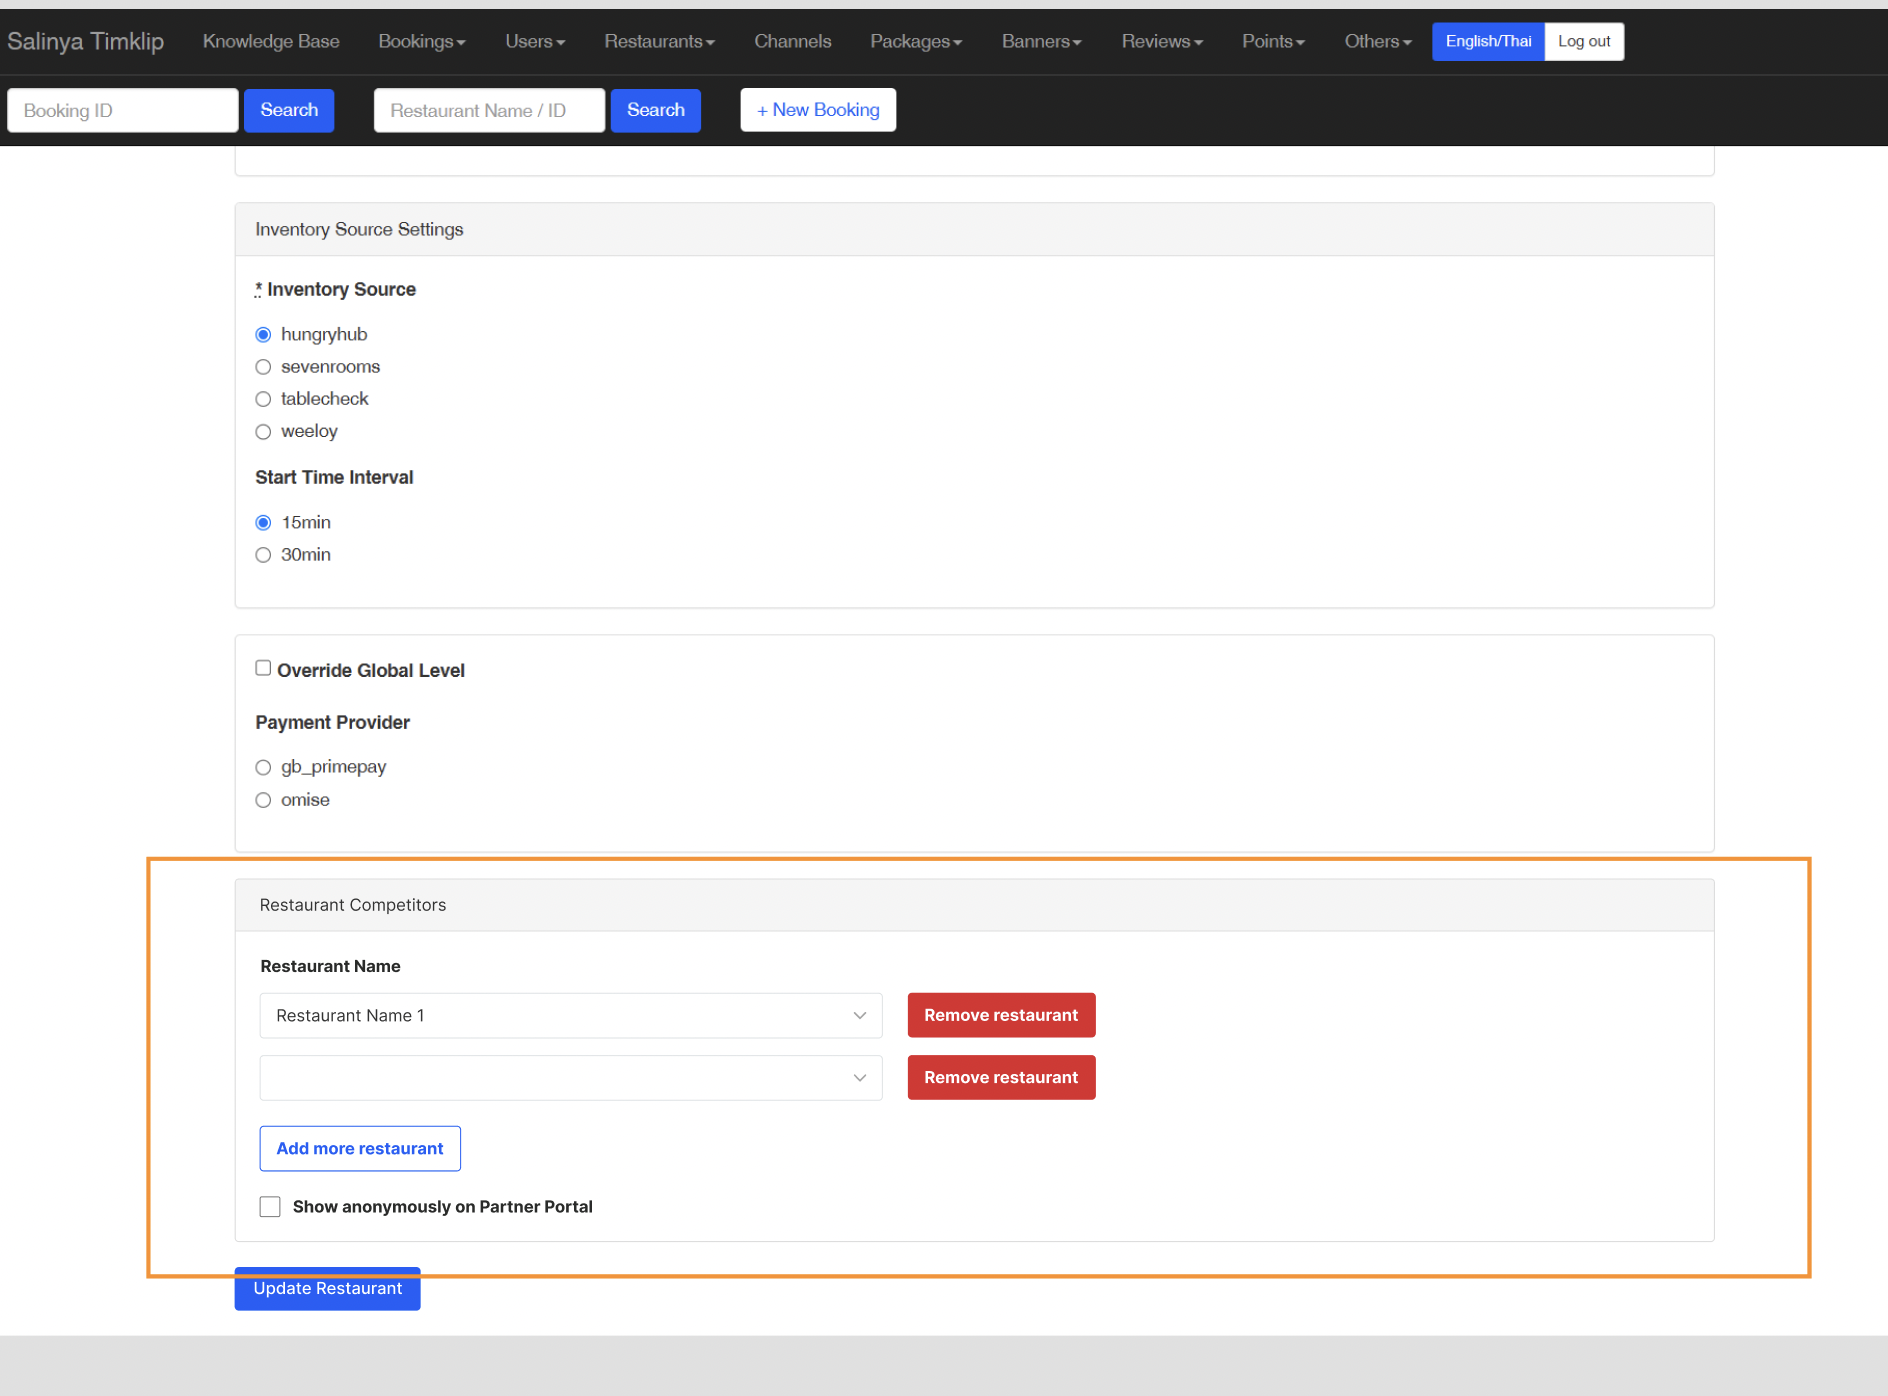
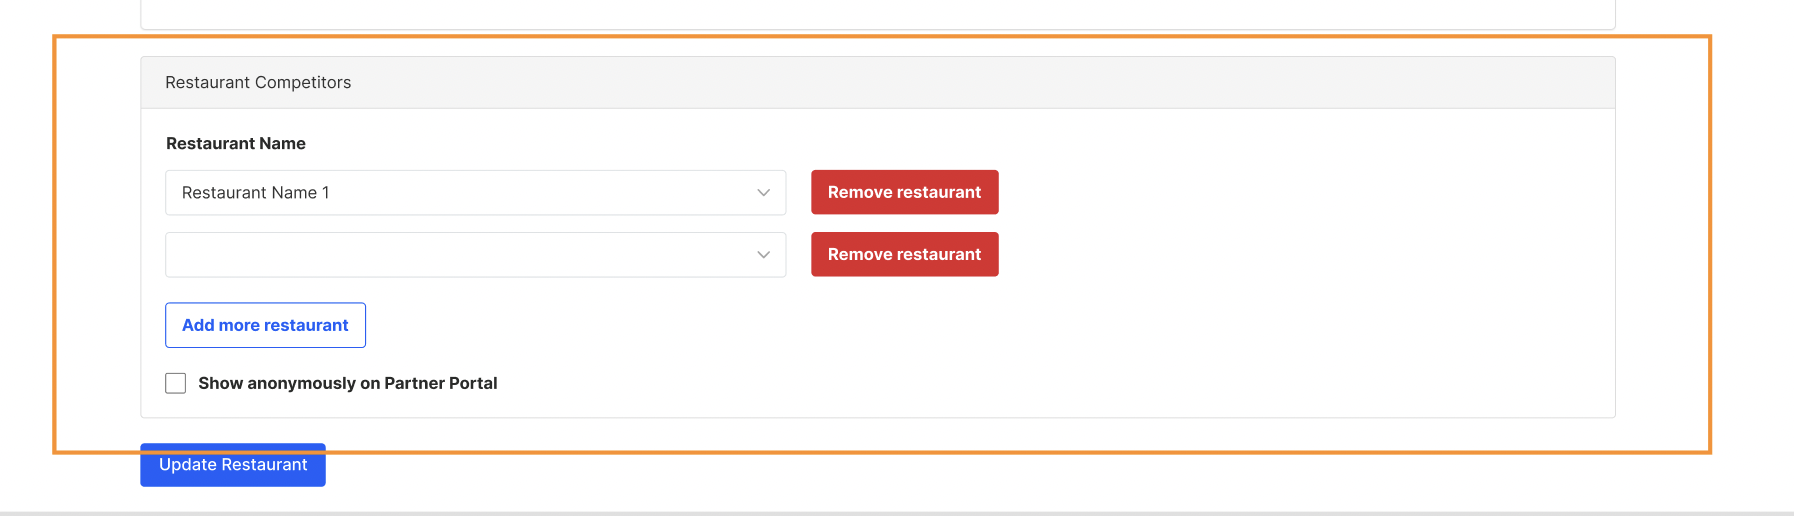
- Competitor Group (Yellow Box):
- Set manually per restaurant in the Edit Restaurant Page using a searchable dropdown for restaurant names.
- Set manually per restaurant in the Edit Restaurant Page using a searchable dropdown for restaurant names.
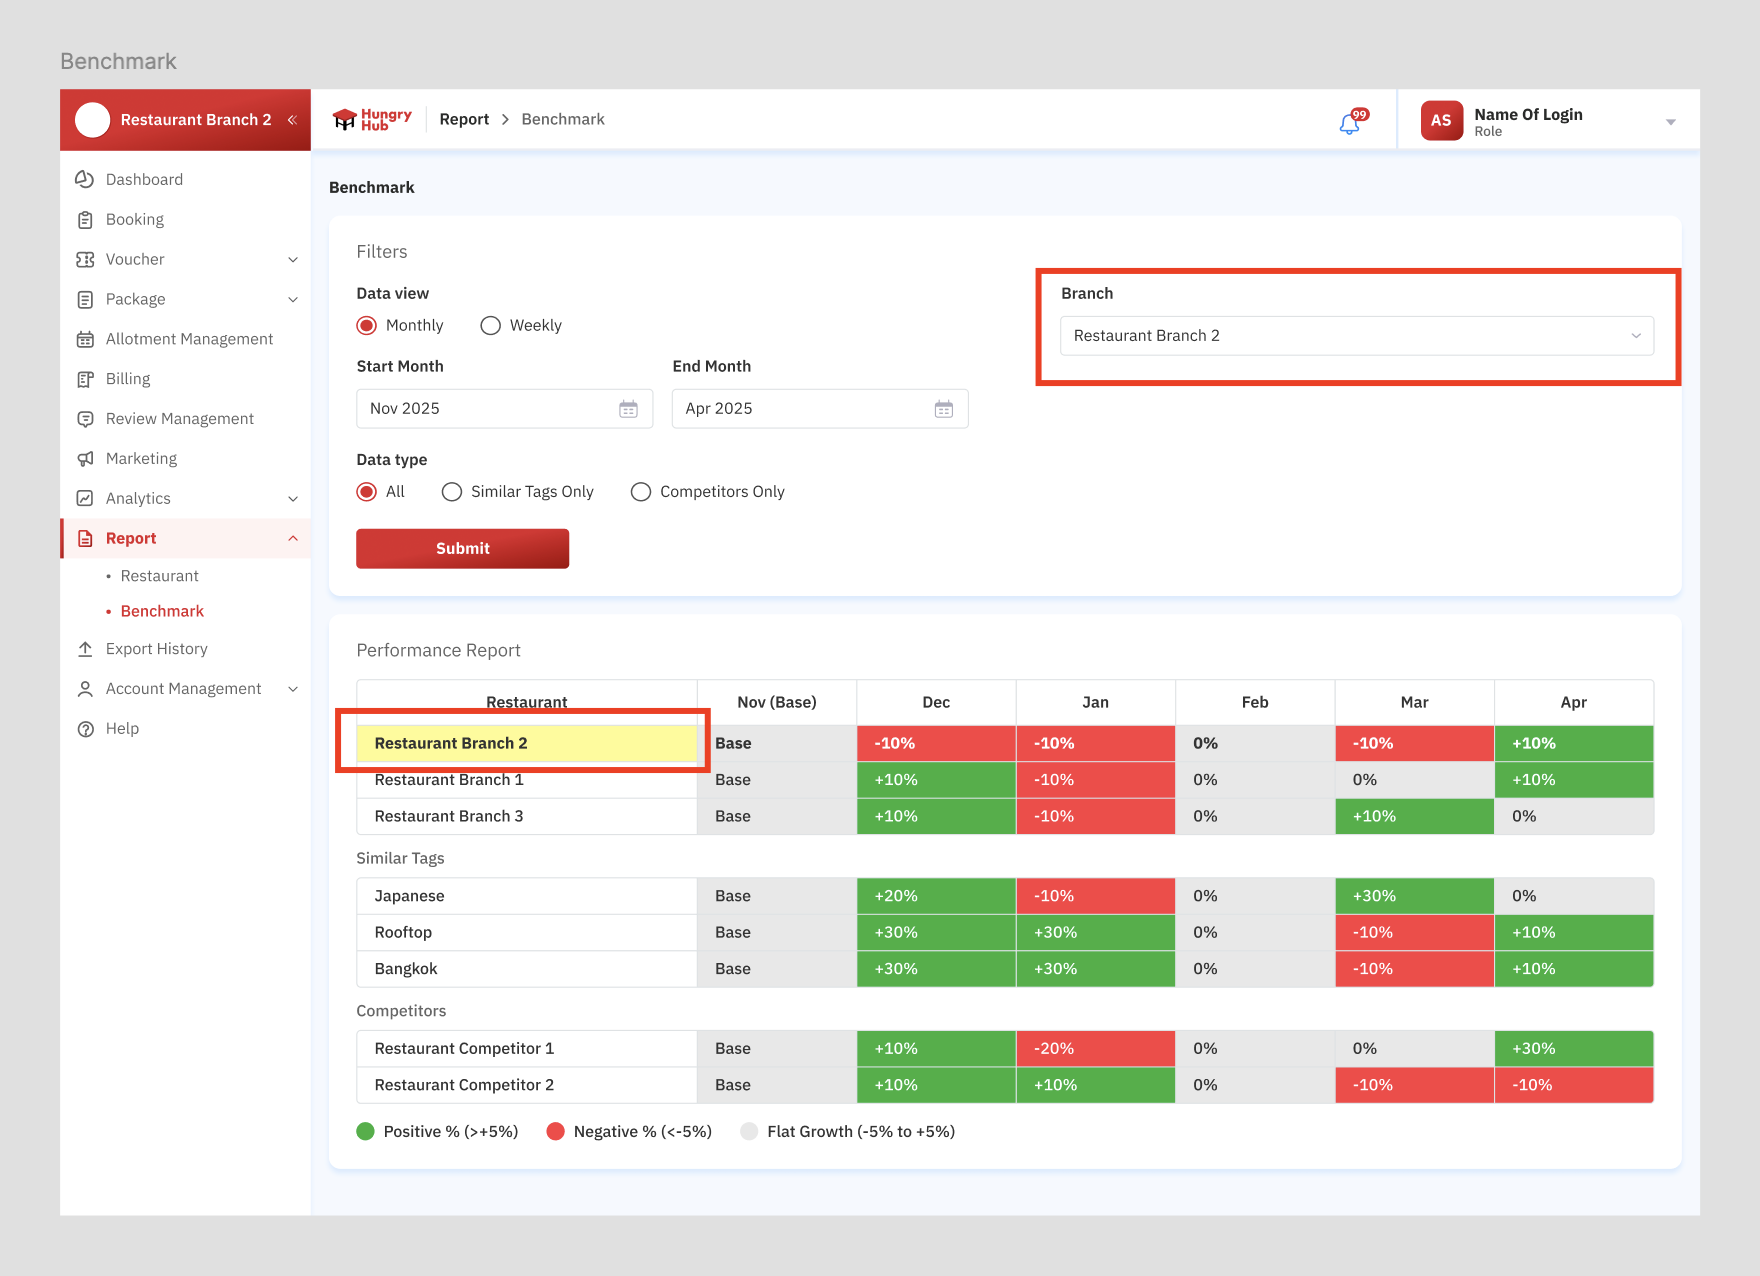
Data Columns
- Row Header: Restaurant Names.
- Columns: Each of the 2-6 months/weeks.
- Values: growth vs. base month/week (e.g., Nov).
- Highlight Current Restaurant: The currently viewed restaurant row should be highlighted (e.g., bold or background color).
- highlighted restaurant for the selected restaurant (yellow color). but the other branch no need to be highlighted.
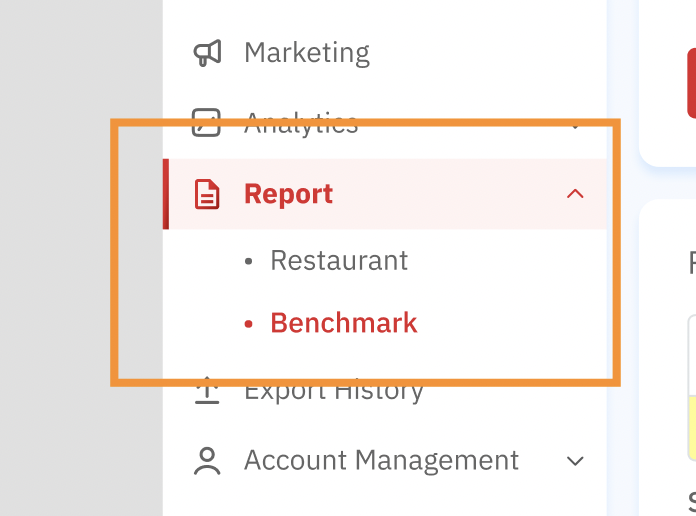
UI/UX Enhancements
Benchmark Page
- Add subpage below the report page
- Restaurant (existing)
- Benchmark (new page)
Base Display
- Use
"Base"as a label for the first week/month.
Color Indicators
- Positive % (>+5%) → Green (↑).
- Negative % → Red (↓).
- Flat Growth (-5% to +5%) → Grey or black.
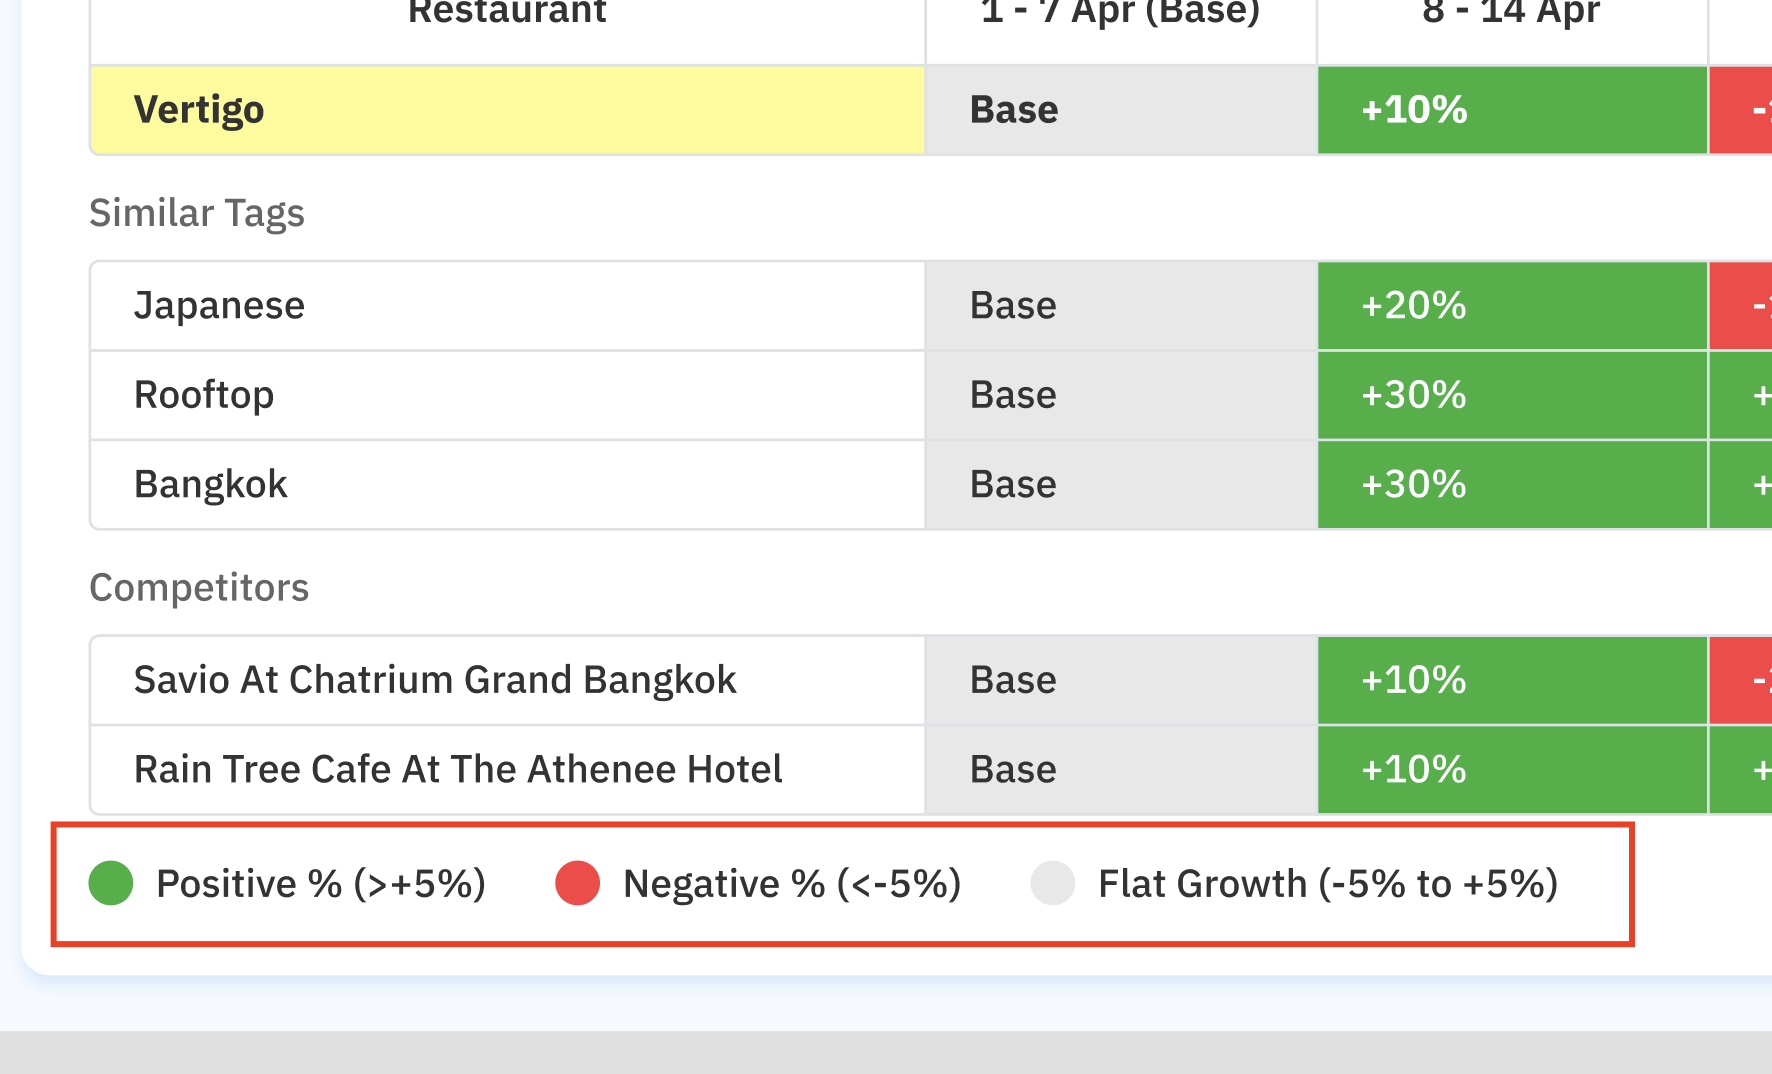
Table Layout
Performance Report
 Average Spend Per Person Report
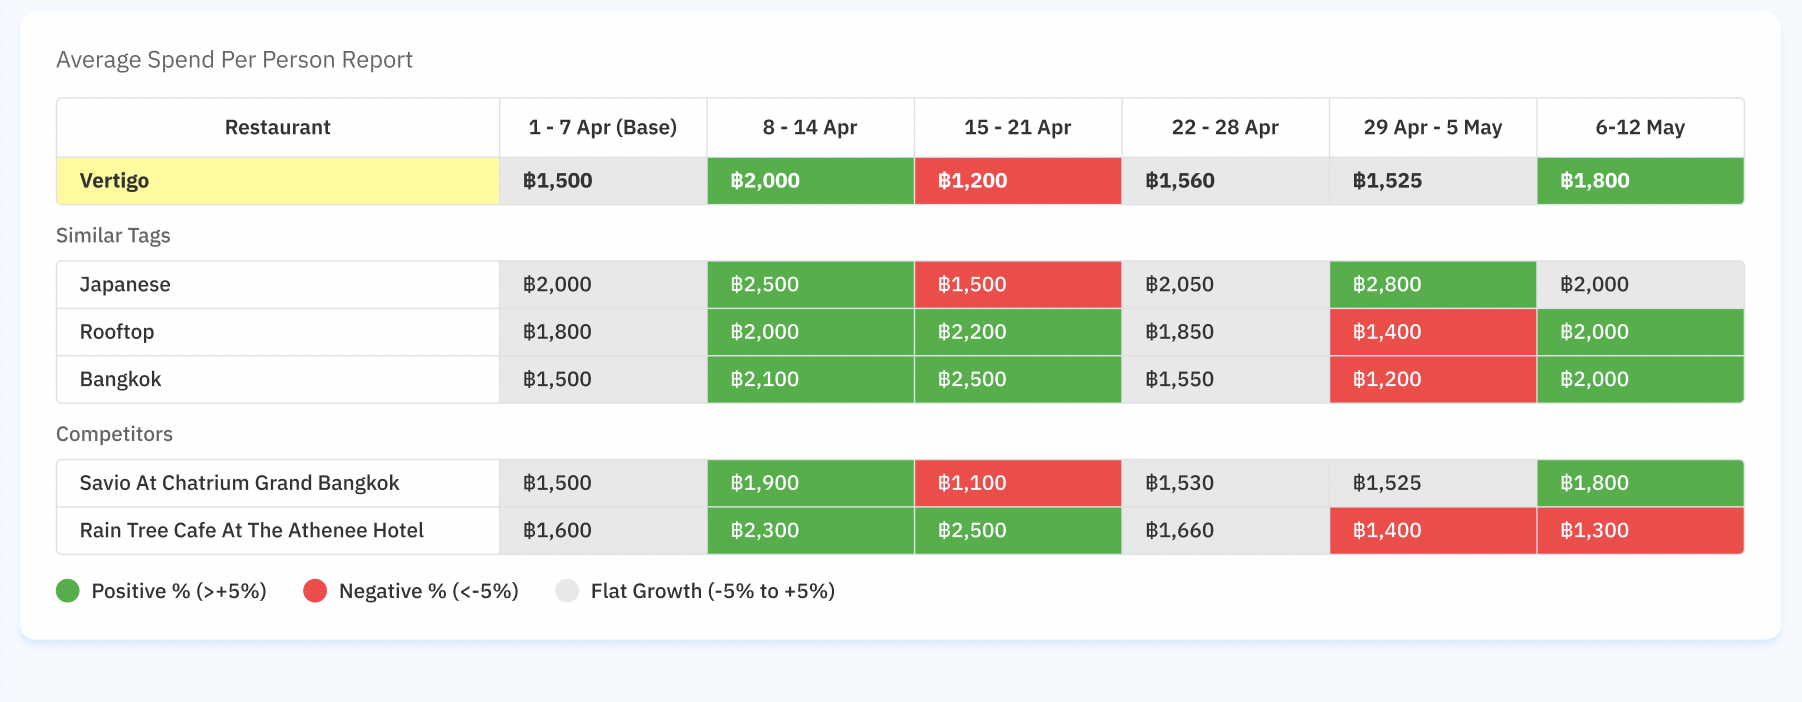
- Show each group (similar tags and competitors)
- Sticky header and scrollable table for readability.
Admin Dashboard
- Allow assignment of restaurant competitors via searchable dropdown in Edit Restaurant Page.
- If there is no competitors on admin dashboard setting, hide the section on the table on partner portal
- add checkbox button to show the restaurant as anonymous on partner portal.
- Active, show the list by the Restaurant Competitor 1, Restaurant Competitor 2, Restaurant Competitor 3, and so on
- Inactive (default), show the list by the real restaurant name
Filters
- Month/Week Range Picker (2 months/weeks max and 6 months/weeks max).
- Toggle display:
- All
- Show restaurant, similar tags and competitors
- Similar Tags Only
- Show restaurant and similar tags
- Competitors Only
- Show restaurant and competitors
- All
- Branch option → Group Login
- The dropdown option is one of the restaurant, so there is no
All Branchesoption
- The dropdown option is one of the restaurant, so there is no

Figma :
[
www.figma.com
https://www.figma.com/design/ymdLN2ZKzfI0oyX4kps2GQ/Partner-Portal-Desktop?node-id=16465-334&t=uy23dJbZLH38nJvm-1
](https://www.figma.com/design/ymdLN2ZKzfI0oyX4kps2GQ/Partner-Portal-Desktop?node-id=16465-334&t=uy23dJbZLH38nJvm-1)